

 ZA
ZAArticles (7)
How to Use the Relative Vigor Index in Trading
<p dir="ltr">The<strong> Relative Vigor Index (RVI) </strong>is an indicator that calculates the <strong>power</strong> behind price movements. In essence, the RVI indicator attempts to gauge when the market will reverse from the current uptrend or a downtrend. </p> <p> </p> <p dir="ltr">In this blog post we look at the key characteristics of the relative vigor index indicator, how it is calculated, as well as its strengths and weaknesses. Finally, we will be sharing advice on how to design a simple trading strategy based on the RVI indicator.</p> <h2>The formula for RVI </h2> <p dir="ltr">The RVI indicator is based on an idea that the price action has a tendency to close higher compared to the opening prices in an uptrend, and have lower closing prices than opening in a downtrend. </p> <p> </p> <p dir="ltr">A formula to measure the RVI is as follows:</p> <p dir="ltr"><strong>NUMERATOR </strong>= a+(2×b)+(2×c)+d</p> <p dir="ltr"> 6</p> <p> </p> <p dir="ltr"><strong>DENOMINATOR </strong>= e+(2×f)+(2×g)+h</p> <p dir="ltr"> 6</p> <p dir="ltr"><strong>RVI</strong> = SMA of NUMERATOR for N periods</p> <p dir="ltr"> SMA of DENOMINATOR for N periods</p> <p> </p> <p dir="ltr"><strong>Signal Line</strong> = RVI+(2×i)+(2×j)+k</p> <p dir="ltr"> 6</p> <p dir="ltr">Where:</p> <ul> <li>a=Close−Open</li> <li>b=Close−Open One Bar Prior to a</li> <li>c=Close−Open One Bar Prior to b</li> <li>d=Close−Open One Bar Prior to c</li> <li>e=High−Low of Bar a</li> <li>f=High−Low of Bar b</li> <li>g=High−Low of Bar c</li> <li>h=High−Low of Bar d</li> <li>i=RVI Value One Bar Prior</li> <li>j=RVI Value One Bar Prior to i</li> <li>k=RVI Value One Bar Prior to j</li> <li>N=Minutes/Hours/Days/Weeks/Months</li> </ul> <p> </p> <p dir="ltr">As you can see from the formula the RVI also has a <em>signal line </em>that interacts with the indicator. Based on the crossovers and divergences between these two, we extract the trading signals.</p> <p dir="ltr">As many other trading platforms, <a data-di-id="di-id-6e0d35b7-1d3b3793" href="/metatrader5">MetaTrader 5</a> has a built-in RVI indicator. You simply choose the indicator from a drop-down menu and it will show up automatically on your chart. <em>The default setting is based on 10 periods</em>, in addition to a green color for the RVI oscillator, and red for the signal line.<br /> <br /> <img alt="" src="/TMXWebsite/media/TMXWebsite/Image-1-Vigor-index.jpg" /><br /> <br /> The RVI indicator fluctuates around the centre line and <em>it travels from above to below zero</em>, and vice versa. As you can see from the photo below, the values are rising as the price trades in a bullish environment and vice versa. The indicator is classified as a centered oscillator, since it oscillates around the center line rather than a banded oscillator.<br /> <br /> <img alt="" src="/TMXWebsite/media/TMXWebsite/Image-2-Vigor-Index.jpg" /><br /> <br /> </p> <h2>Strengths and weaknesses of RVI</h2> The RVI compares the asset’s closing price to a recent price range and generates values of the power behind price movements. The higher the values it generates, the stronger the trend should be. On the other hand, lower RVI values imply a calm and sideways market. <p dir="ltr"> </p> <p> </p> RVI generates values which sometimes trade near the extreme levels up and down. Similar to the <a data-di-id="di-id-e48f415c-dc5b1189" href="/trading-academy/forex/analysis/rsi-indicator">Relative Strength Index (RSI)</a> in these situations, the RVI signals that a change in the trend direction is probable, which is actually its greatest strength. <p dir="ltr"> </p> <p dir="ltr">On the other hand, the key weakness associated with the RVI is that it is practically useless in the ranging markets, when the price action doesn’t move in a clear uptrend or downtrend. Hence, traders tend to usually consult the RVI when the price action trades in the uptrend or downtrend for a longer period of time, as they try to predict when the current trend will end. <br /> <br /> <br /> </p> <h2>Crossover and divergence</h2> <p dir="ltr">As noted earlier, the RVI indicator interacts with the signal line, creating different types of signals. For instance, a trading signal is generated when the RVI moves above the signal line. This situation is called a bullish crossover and it indicates that the price action is likely to start moving upwards. The bearish crossover is the opposite of the bullish crossover i.e. the RVI crosses below the signal line. </p> <p> </p> <p dir="ltr">On the other hand, the interaction between the RVI and the price action can produce a <a data-di-id="di-id-201c69d3-252d29a6" href="/trading-academy/forex/analysis/bullish-bearish-divergence">bullish and bearish divergence</a>. The former occurs when the RVI creates a higher low or a higher high, while the price action creates a new low. It signals that the price action is likely to start following the RVI higher.</p> <p> </p> <p dir="ltr">The latter takes place in the opposite scenario - the price action is still trading in an uptrend, but the RVI has already started to come off the highs, which implies that the asset’s price will start following the RVI in moving lower. </p> <h2>How to trade the RVI </h2> <p>There are many different<strong> trading strategies based on the RVI indicator</strong>, as it is the case with the RSI and other oscillators. The vast majority of those are centred around either crossovers or divergence. <br /> <br /> Here we are sharing a very simple trading strategy that tends to mix these two scenarios - a crossover and divergence. This way we get two signals pointing to the same future development - a reversal.<br /> <br /> In a chart below, you see USD/CAD moving lower, below the most recent low. The RVI follows and creates a short-term low, trading extremely close to its minimum levels. Remember that the RVI should only be consulted in the trading markets.<br /> <br /> <img alt="" src="/TMXWebsite/media/TMXWebsite/Image-3-Vigor-index_1.jpg" /><br /> <br /> </p> <p>The RVI then generates two bullish signals. First, the crossover occurs as the RVI indicator<em> (the green line) </em>moves above the signal line <em>(the red line)</em>, signalling that the trend is likely to change from bearish to bullish. <br /> <br /> Secondly, the price action creates a series of consecutive lower lows, a situation which is not confirmed by the RVI, which starting with a crossover continues to move higher. As we noted earlier, this situation is called <em>a bullish divergence</em> and it signals that the price action may start following the RVI higher soon. <br /> <br /> At this point, two bullish signals convince us to open a trade and look for a reversal. We opened a long trade aiming to capitalise on the impending trend reversal as the sellers seemed to have run out of gas.</p> <p> </p> <p>The entry should be placed once both the crossover and the divergence issue bullish signals. The stop loss is placed around 40 pips below, to allow for the price action to potentially create another short term low. <br /> <br /> Take profit is determined by searching for a “magnet level” - an important price point that played an important role in the past. This can be either a <a data-di-id="di-id-9ff3eeec-f5d0272a" href="/trading-academy/forex/analysis/fibonacci-ratios">Fibonacci retracement/extension</a>, moving average, trend line etc. In this case, we use the previous swing low, which is now likely to act as a resistance. </p> <p> </p> <p>Ultimately, <strong>the price action creates a sharp reversal</strong>, surging higher and hitting our take profit order in just two days. In this trade, we risked 40 pips to make around 80 pips, which translates to a 1:2 risk-reward.</p>

What is a stock market index?
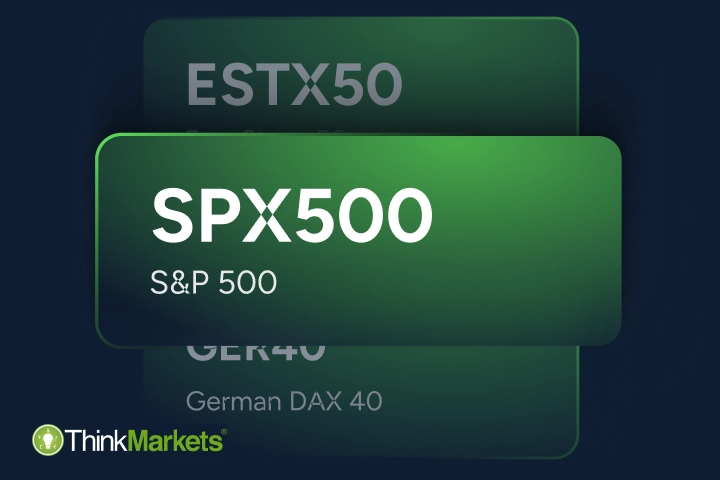
<p>The stock market we know today is nothing like it used to be when the concept was born. Hundreds of years ago, the stock market started as a small institution created by agricultural traders and banks of Europe to manage and regulate commodity trading. Fast forward to the 21st century, it has transformed into a comprehensive global network of stock exchanges.<br /> <br /> The modern stock market, also called the share or equity market, offers various financial instruments (securities) on dozens of exchanges worldwide – stocks, shares, bonds, mutual funds and others.<br /> <br /> When a number of such securities are put together, it's called a stock index. In this article, we'll take a closer look at stock market indices, explain how they work and the benefits of index trading</p> <h2>What is a stock market index?</h2> <p>A stock index is a basket of various financial instruments. However, most indices that are available for public trading typically include only companies' shares. These companies have to be publicly listed on a stock exchange, meaning their shares can be bought, sold and owned by the public.<br /> <br /> There are different ways of organising these companies into stock indices – they can be grouped by financial market, country, industry or another differentiator. This allows analysts to track and measure the performance of the category they belong to and calculate market performance. For example, if an index value of the US major companies is going up in value, it usually means that the country's economy is expanding.</p> <h2>What is an index ticker?</h2> <p>An index ticker, also called a symbol or code, is a combination of letters and numbers used for the index's easy identification and tracking. Just like each currency has a code in the forex market – EUR for the euro, USD for the US dollar and so on, indices also have their own code. For example, S&P 500 stands for The Standard and Poor's 500 index. The term ticker is not exclusive to stock indices and used in other markets, such as stocks, futures and ETFs, too.<br /> <br /> Keep in mind that brokers usually use different tickers to distinguish instruments used to trade indices. For example, with ThinkMarkets, you can trade indices with CFDs, so to differentiate the actual S&P 500 index from a CFD contract on it, the latter has the SPX 500 ticker.<br /> <br /> <img alt="TM-Screen-What-is-a-stock-index-1.png" src="/getmedia/a5189b4f-bfff-48cf-b265-c184ed7acada/TM-Screen-What-is-a-stock-index-1.png" style="display: flex; margin: 20px auto;" title="TM-Screen-What-is-a-stock-index-1.png" /></p> <h2>What are the most popular indices in the stock market?</h2> <p>The popularity of a stock index depends on where the companies within it originate. For example, with the US being the largest economy in the world, American stock indices make up over 50% of the value of the global stock market. It is no surprise that these indices are the most popular and the most traded in the world, with S&P 500, Nasdaq 100 and Dow Jones usually leading this list.<br /> <br /> <img alt="01-map-1.png" src="/getmedia/3f976ffd-1a3e-4015-98e0-a1c5a6f1d6ea/01-map-1.png" style="display: flex; margin: 20px auto;" title="01-map-1.png" /></p> <h3>S&P 500 (SPX 500)</h3> <p>The S&P 500 is a stock market index that tracks the performance of the 500 largest companies in the US. It is considered the benchmark of the American economy because the aggregated value of the companies within it represents over two-thirds of the US stock market’s value.</p> <h3>Dow Jones Industrial Average (US 30)</h3> <p>The Dow Jones Industrial Average index is very similar to the S&P 500 but tracks only the 30 largest companies. Due to their similarity, these two stock indices are highly correlated and tend to move in the same direction.</p> <h3>Nasdaq 100 (NAS 100)</h3> <p>The Nasdaq 100 index consists of the 100 largest non-financial companies' stocks. The companies that make up this stock index represent various industries, but due to the dominance of major technology sector players, NAS 100 is tech-heavy.<br /> <br /> Other popular indices usually track the performance of large economies, such as the total market index of the UK – FTSE 100 (UK 100), Japan – Nikkei 225 (JPN 225), Germany – DAX 40 (GER 40), and others.</p> <h2>Why is index trading popular?</h2> <p>Index trading attracts a fair share of retail traders looking for personal gain. Here is why it's so appealing to them:</p> <h3>Diversification</h3> <p>Due to their nature, indices provide traders with greater exposure than any other financial market, limiting risk at the same time, as they are less likely to be affected by a sharp move from a single stock.</p> <h3>Comfortable volatility levels and consistent trends</h3> <p>Broad diversification results in more consistent trends and much milder volatility that rarely sees enormous price jumps, which can be very appealing for risk-averse traders.</p> <h3>Reliability</h3> <p>The stock market is well established. It's been around for a couple of centuries and has had enough time to set clear rules and regulations. Stock exchanges around the world are managed by reputable and trustworthy institutions that would crack down on fraud or price manipulation.</p> <h2>How are indices made?</h2> <p>The list of companies that make up a specific stock index is not permanent. Every index has a set of criteria a company needs to meet to be included in a certain stock index. The requirements may vary from index to index, but market capitalisation and liquidity thresholds are usually among the most common ones. As market conditions change and economies evolve, some companies may fall out of an index while others may become a better fit for it.<br /> <br /> The eligibility requirements also depend on the index's type. For example, indices that are weighted by company value may have very different prerequisites compared to indices weighted by stock prices. In our next article, <a href="/za/trading-academy/indices/stock-market-indices/">Stock market indices: all the types you need to know</a>, we explore different types of indices and explain how they can be calculated.<br /> </p>

Stock market indices: all the types you need to know
<p>Traders just getting into stock market indices may notice a lot of different terms used to define them, such as small cap, equal weighted, growth index and many others. All these names are used to define what types of stocks make up an index to facilitate market analysis for traders.<br /> <br /> In this article, we’ll help you outline the main types of indices and their differences.<br /> <br /> Let's start with one of the most common ways to categorise indices – by the weight of stocks within them.<br /> <br /> <img alt="" src="/getmedia/6ade89c8-1b01-4102-8d86-e205dff6a416/article-indeces-types-all.webp" style="width: 552px; height: 269px;" /></p> <h2>Weighted indices</h2> <p>There are three types of indices by weight:</p> <h3>Market capitalisation-weighted indices</h3> <p>A company's market capitalisation means its value on a market. It can be calculated by multiplying the total number of outstanding shares (all the shares it has ever issued) by the share price.<br /> <br /> For example, if company A has 100,000 shares priced at USD 20, its market cap is:<br /> </p> <p style="text-align: center;"><strong>100,000 X 20 = USD 2,000,000</strong><br /> </p> <p>If an index is weighted by market cap, it means that the companies with a higher market capitalisation or value are given more weight. Simply put, higher valued companies have more importance in a market cap-weighted index. For example, if the index value is USD 500 million, a company worth USD 100 million will make up 20% of the index value. Price movements of this company have more effect on the index than a company with a USD 10 million market cap.<br /> <br /> <img alt="" src="/getmedia/05c99dd9-460d-494a-94d5-9806c49b8c66/article-indeces-types-market-cap-weight.webp" style="width: 552px; height: 336px;" /><br /> <br /> Market cap indices are the most common because they provide a clear and accurate way of evaluating stocks within an index. It also makes the performance analysis of an index much easier, as it is based on stocks’ true value. Almost all the top-traded indices we discussed in our previous <a href="/za/trading-academy/stocks/what-are-stocks">What is a stock index</a> article are weighted by their market cap – S&P 500 (SPX 500), Nasdaq 100 (NAS 100), FTSE 100 (UK 100), DAX 40 (GER 40) and Nikkei 225 (JPN 225).<br /> <br /> However, most of these indices list stocks by free-float market capitalisation. It means that the company’s market cap is calculated by taking into consideration only the publicly held shares, ignoring the privately owned ones.</p> <h3>Price-weighted indices</h3> <p>The companies within price-weighted indices are given weight according to their current share price. The most expensive shares will have more importance compared to the lower-priced ones. For example, a company with a share price of USD 1,000 will have a much stronger effect on the index performance when its price fluctuates compared to a company with USD 100 shares.<br /> <br /> The Dow Jones (US 30) index is one of the most popular examples of a price-weighted index.<br /> <br /> <img alt="" src="/getmedia/b34fc161-34a4-4156-b9a1-74397245b666/article-indeces-types-price-weight.webp" style="width: 552px; height: 336px;" /><br /> <br /> Price-weighted indices are less common than market cap ones because stock prices are not always an accurate indication of their true value.</p> <h3>Equal-weighted indices</h3> <p>This way of calculating indices is the most intuitive – each company carries equal weight, value and importance, regardless of the company's size. Simply put, in an index made up of 100 companies, each company represents only 1% of the overall index's price.<br /> <br /> <img alt="" src="/getmedia/8d4a5809-05db-4b49-b5fa-af0c38918e1a/article-indeces-types-equal-weight.webp" style="width: 552px; height: 336px;" /><br /> <br /> Equal-weighted indices are quite popular among traders because they don't depend on the largest stocks as much as the market cap indices, which reduces the risk for traders.<br /> <br /> Keep in mind that some indices can have several variations. For example, the S&P 500 is commonly used as a market capitalisation-weighted index, but there is also a lesser known, equally weighted version. This equal-weighted S&P 500 is tracked under a different ticker and has the same list of companies, but they are given a fixed weight.</p> <h2>Market capitalisation indices</h2> <p>The market-cap indices can be further divided into three smaller groups:<br /> </p> <ul> <li>Large cap indices – over USD 10 billion</li> <li>Mid cap indices – USD 2 – 10 billion</li> <li>Small cap indices – USD 300 million – 2 billion</li> </ul> <p> </p> <p>This method of index classification is also very popular among traders as it gives an immediate indication of the index’s nature. You’ll often see it in the name of the index right away, for example, Russel Mid Cap 2000 index (US 2000). If you don’t see any indication, it implies that the index is a large cap, like all the most popular indices we’ve mentioned above.</p> <h2>Indices by geographical affiliation</h2> <p>On a wider scale, indices are usually divided by the geographical location of the companies included in them.<br /> </p> <ul> <li>Global (worldwide) indices track stocks from all over the world. For example, the MSCI world index consists of stocks from 23 countries.</li> <li>Regional indices consist of stocks of a particular region. The Euro Stoxx 50 index (ESTX 50), composed of 50 blue-chip companies from 11 countries of the Eurozone, is one good example of a regional index.</li> </ul> <p>It's worth mentioning that there are indices that are somewhat similar to regional, but they combine stocks from various locations based on the economic advancement of their country of origin – developed or emerging.<br /> </p> <ul> <li>National indices are made up of stocks of the same country. These indices are the most popular and heavily traded because their performance is correlated with their respective country’s economic growth, making it easier to evaluate and identify trading opportunities. That’s where the top-traded indices from our list belong, among many others.</li> </ul> <br /> <br /> National indices, along with the sectoral ones, are often used as a benchmark – a standard to measure the performance of other indices against, as they usually include the best-performing stocks of their category. <p> </p> <h2>Sectoral indices</h2> <p>This classification is popular among traders because companies that belong to the same economic sector are usually influenced by the same factors and perform similarly, making the analysis easier.<br /> <br /> According to the Global Industry Classification Standard, there are 11 official stock market sectors:<br /> </p> <ul> <li>Financials</li> <li>Healthcare</li> <li>Energy</li> <li>Materials</li> <li>Utilities</li> <li>Industrials</li> <li>Real estate</li> <li>Consumer discretionary</li> <li>Consumer staples</li> <li>Information technology</li> <li>Communication services</li> </ul> <p> </p> <h2>Indices by stock types</h2> <ul> <li>Value indices are made of stocks that tend to preserve value, combined with slow but steady growth, resulting in very low volatility. Due to reduced trading opportunities, these indices are rarely of any interest among day traders. However, they are often appreciated by long-term investors.</li> </ul> <ul> <li>Growth indices consist of companies with above average sales growth and may experience periods of high volatility. The most traded stocks usually belong to this category.</li> </ul> <h2>Islamic indices</h2> <p>Besides the outlined common types of indices, analysts often segregate Islamic indices into a separate category. These indices can be further categorised following the same logic as other indices, but they only include stocks of the companies that comply with Sharia law. However, due to some limitations and controversies, these indices are more popular among long-term investors than active traders.<br /> <br /> It's important to check some basic information about an index before you start trading it, as it can help you evaluate future price movements and identify trading opportunities. In market cap and price-weighted indices, for example, you'll need to pay closer attention to factors affecting the largest and most expensive stocks as they affect the overall price of the index. On the other hand, equal-weighted indices are more sensitive to factors affecting their overall performance. National indices will heavily depend on the economy of the country they belong to, sectoral on a sector and so on. Now let's see <a href="/za/trading-academy/indices/what-affects-stock-index-prices">what can affect stock market indices' price movements.</a></p>
How to trade indices
<p>Unlike many other financial markets, stock indices don't provide an option for their physical exchange. It is simply not feasible as indices are made of dozens and hundreds of stocks. It also means that direct investment in indices is not possible – you can't buy them like shares. However, there are various financial instruments that mirror the performance of indices and can be traded and invested in. One good example of such financial instruments is derivatives.<br /> <br /> With ThinkMarkets, you can trade stock market indices with derivatives called contracts for difference – CFDs. There are two types of CFDs – contracts on the current price and contracts on index futures. It may seem a little complicated, but all you need to do in both cases is speculate on price movements. In the first case, it’s the movement of a current price and in the second, the movement of a future price. If your prediction is correct – your trade is successful, and if the price moves in the opposite direction of your prediction, your trade incurs a loss.<br /> <br /> If you are new to derivative trading, check out our <a href="/en/trading-academy/cfds/what-are-cfds">CFD trading: a beginner’s guide</a> where we explain what derivatives are and how CFD trading works in detail.<br /> <br /> Keep in mind that brokers usually use different tickers to distinguish instruments. For example, on ThinkMarkets’ trading platforms, S&P 500 is marked as SPX 500 for CFD trades on the current price and ESH3 for CFD trades on the futures contracts.</p> <h2>How to trade indices with CFDs</h2> <h3>Going long</h3> <p>Assume you were to place a trade on the SPX 500 index. The current price is USD 4,000.00, and you think it will go up. You open a long CFD position (buy), and the price goes up to USD 4,010.00. The USD 10 is your profit. If the price goes down to USD 3,990.00 instead, USD 10 is your loss.<br /> <br /> <img alt="" src="/getmedia/d4e439ef-1d47-4500-9a69-cd9515fb48bc/article-how-to-trade-indices-long.webp" style="width: 552px; height: 434px;" /></p> <h3>Going short</h3> <p>In the opposite scenario, your prediction says the price will go down, and you place a short CFD trade (sell). If the price goes down to USD 3,990.00, as you predicted, USD 10 is your profit. If it goes up to USD 4,010.00 instead, USD 10 becomes your loss.<br /> <br /> <img alt="" src="/getmedia/8eac9b34-5ae0-4486-853d-01343c1207ea/article-how-to-trade-indices-short.webp" style="width: 552px; height: 442px;" /><br /> As you can see, it’s pretty straightforward. Now, let’s see the difference between trading CFDs on the current prices of indices and CFDs on index futures.<br /> <br /> When you trade CFDs on the current price of a stock market index, it means your contract follows its real-time price, and you speculate on the current price as well. On the other hand, a CFD on the index futures contract means speculating on the index's price at a certain date in the future.<br /> <br /> In both cases, trading indices with CFDs gives you extended trading hours, unlike some other types of trading. There is a simple explanation: while stocks are listed on the exchanges with fixed and limited opening hours, CFDs are not listed anywhere. As they only track the index's price, it remains set at its closing price while the exchanges are closed, making it available for trading. Once the exchanges are open again, the price is adjusted. You can find more info on the trading hours on the contract specifications page.<br /> <br /> Whichever way of trading you choose, there are a few more terms you need to know to understand your index CFD trade better.</p> <h3>Points and ticks</h3> <p>The price movements in index trading are measured in points and ticks. A point refers to the smallest price movement on the left side of the decimal point. A tick, on the other hand, refers to the smallest price movement on the right side of it. The value of one point equals USD 1, and one tick is USD 0.01.<br /> <br /> This terminology is not exclusive to stock indices and applies to all financial markets except forex, which measures price movements in pips. However, the values of a point and a tick vary depending on the market.<br /> <br /> <img alt="" src="/getmedia/c850f30e-f907-4925-89f3-2c8a218d3ff7/article-how-to-trade-indices-ticks.webp" style="width: 268px; height: 160px;" /></p> <h3>Spread</h3> <p>A spread in index trading, just like in any other financial market, means the difference between the buy (bid) and sell (ask) price. For example, on the image below, you can see that a spread of SPX 500 is 0.4 or 40 cents. Essentially a spread is the cost of any trade. That’s exactly why any new trade a trader opens starts at a loss – the spread amount gets deducted automatically and needs to be covered first before making a profit if the trade is successful.<br /> <br /> <img alt="" src="/getmedia/1c0a768a-b4a9-4fe0-9008-3e83bc9292d7/article-how-to-trade-indices-spread.webp" style="width: 552px; height: 152px;" /><br /> Keep in mind that the placement of a decimal point is different in index trading and trading stocks. The same 40 cents spread in stock trading would be marked as 40.0.</p> <h3>Lots</h3> <p>A lot in trading represents a trade size, or in other words, the number of units of a financial instrument. This number is different for every financial market. In the stock market, one lot contains ten contracts or ten CFDs in our case. When you trade indices, there are usually minimum trade size requirements set by the broker. With ThinkMarkets, some indices can be traded only in full lots and some in mini lots – 0.1 of a full lot (1 CFD). You can find these details on the contract specifications page as well.<br /> <br /> <img alt="" src="/getmedia/3c1474ed-b4ef-404b-a3a0-96cb488a79c9/article-how-to-trade-indices-lots.webp" style="width: 480px; height: 368px;" /></p> <h3>Leverage and margin</h3> <p>Trading indices with CFDs implies using leverage. It means traders borrow funds from a broker to open positions exceeding their account balance. To allow the utilisation of their funds, brokers require a deposit, called a margin. We explain both concepts in detail in the <a href="/en/trading-academy/cfds/what-are-cfds">CFD trading: a beginner’s guide</a>, too.<br /> <br /> When you trade with leverage, you don't need to pay the full price to place a position, only the deposit (margin). The amount of the deposit depends on how big your leverage is – bigger leverage means a smaller deposit, and vice versa. The level of leverage varies depending on the market and instrument and is usually set by a broker for each specific stock market index.<br /> <br /> Let's see how leverage works in index trading on the same example, where we placed a CFD trade at USD 4,000.00. If you open this trade with 200:1 leverage, you only need to pay 1/200th of the full amount, or USD 20.<br /> <br /> <img alt="" src="/getmedia/098e2e5b-7756-417c-bed7-29873b1b1c8c/article-how-to-trade-indices-leverage.webp" style="width: 459px; height: 308px;" /><br /> <br /> That's the main benefit of trading indices with leverage – you can open a much bigger position with a smaller deposit. Your potential profit is also multiplied. However, if you incur a loss, it does get multiplied too. That's why it's crucial to use <a href="/en/trading-academy/cfds/risk-management-tools-in-cfd-trading">risk management tools</a> like stop loss and take profit.<br /> <br /> Understanding this basic information is crucial to a successful index trading journey. Once you are confident with fundamentals, you can move on to creating a sophisticated trading strategy. However, it is highly advisable to practise on a demo account first before trading with real money.</p>
What affects a stock index price?
<p>Understanding what moves the stock index prices is crucial for a successful trading strategy. Knowing the bigger picture can help you make an informed decision and identify the right time to place a buy or sell order instead of trying to predict price movements sporadically.<br /> <br /> It is true that the past performance of any financial instruments, indices included, doesn't always serve as a good indication of their future movements. It's important to look at other factors that drive stock index prices up or down to identify trading opportunities.<br /> <br /> These factors can be divided into two groups: those that influence individual stock prices within an index and those that drive an index as a whole.</p> <h2>Factors influencing individual stocks within an index</h2> <p><img alt="" src="/getmedia/6e2a8dba-8d06-44c2-bb37-e28461ba1b05/article-what-affects-stock-index-prices-individual.webp" style="width: 552px; height: 283px;" /><br /> <br /> The first group is particularly important for indices <a href="/za/trading-academy/indices/stock-market-indices">weighted by market cap or stock price</a>, as their price can be significantly affected by the top-performing stocks.<br /> <br /> For example, tech giants like Apple, Microsoft, Amazon, Google (Alphabet) and Meta make up almost 40% of the Nasdaq 100 (NAS 100) index, each accounting for 3-11% weight of the index. If any of these companies experience significant changes in their stock price, it will affect the price of NAS 100 to a much greater extent than a company holding only 0.2% weight of the index.<br /> <br /> To evaluate the possible price fluctuations of top performance in an index, experienced traders usually identify them first and then look for the following information:</p> <h3>Company earning reports</h3> <p>Bigger than expected profits are likely to drive the stock (and index) price up, while unexpected losses can have the opposite effect. Earnings reports are usually released quarterly and published during the first month of the following quarter.</p> <h3>Announcement of dividends</h3> <p>Some traders are hunting for dividends, buying shares shortly before the dividend announcement, also called the ex-dividend date. This drives the demand up, increasing the stock price as a result. After the dividend pay-out day, they sell their shares, which causes an immediate drop in their price. As most companies pay dividends quarterly or semiannually, it is worth keeping an eye on these releases to catch index trading opportunities.</p> <h3>Management restructure</h3> <p>A CEO or any other key role replacement can have a big impact on the stock price, affecting the entire index price. The direction of the price movement usually depends on market sentiment. If traders see the successor as competent, it can increase the stock price and vice versa.</p> <h3>Positive company news</h3> <p>Announcements of a new product launch or expansion usually indicate a company’s solid growth plan, which can drive its share price up, increasing the index price consequently. However, this factor largely depends on market sentiment as well.</p> <h3>Alleged controversies</h3> <p>A company's involvement in controversial reports usually affects its reputation negatively, thereby affecting its share price and bringing the index price down. In some cases, damage can be caused not only by a company’s reputation but by the reputation of its leader as well. For example, Elon Musk, the co-founder and CEO of Tesla, brought price swings to the company’s shares with his publicity stunts more than once.</p> <h2>Factors that affect a stock index price as a whole</h2> <img alt="" src="/getmedia/3bd1a15f-eac2-4a6c-a7c3-02f2ce066815/article-what-affects-stock-index-prices-whole.webp" style="width: 552px; height: 271px;" /> <p><br /> This group of factors usually has a much stronger impact on an index price than factors affecting individual stocks. They can be divided into three sub-groups: economic data, political events and natural calamities.<br /> <br /> When analysing these factors, traders need to keep in mind the origin of the index and the companies listed within it. For example, the US data and events are the most influential for American indices, such as S&P 500, Dow Jones, and Nasdaq 100. On the other hand, for the Euro Stoxx 50 index, which includes stocks from 11 countries within the Eurozone, traders need to keep an eye on data from the countries of origin of the top-performing stocks.</p> <h3>Economic data</h3> <p>Indicators such as interest rates, inflation and Gross Domestic Product (GDP) are among the main factors affecting index prices. As many indices are grouped by industry or country, significant changes in the mentioned numbers usually hit the whole index.<br /> <br /> For example, if the inflation rate in the US increases, it will negatively impact the whole US stock market, bringing down the prices of all major indices in a ripple effect. In the opposite scenario, a strong USD usually has a positive effect on them.<br /> <br /> Increasing interest rates can have a similar effect on index prices, making business loans much more costly for companies, which, in turn, slows down their development, bringing stock prices down.<br /> <br /> On the other hand, a rising GDP signals a strengthening economy and can positively impact an index, driving its price up.<br /> <br /> Keep in mind that all economic processes are interlinked – an increasing GDP in the long term usually means increasing inflation, which means increasing interest rates to fight it and so on. Hence, economic indicators need to be analysed as an aggregate rather than on their own. An <a href="/za/economic-calendar">economic calendar</a> is a great tool that helps traders have all the worldwide data releases in one place.</p> <h3>Political events</h3> <p>Political instability within a country tends to influence the country’s stock market indices negatively. Weak government, protests, and controversial policies can cause a visible decline in index prices. Elections can bring a lot of volatility to the index price too, but this volatility is primarily caused by public sentiment, reacting to election promises given by winning candidates.<br /> <br /> Some large-scale political events have a strong negative influence not only on the countries involved but also on the global economy.<br /> <br /> At the end of June 2016, when the UK voted in favour of leaving the EU, and it became clear that Brexit was, in fact, happening, over USD 2 trillion was wiped out from the global stock market in a single day.<br /> <br /> Another example is the Russian invasion of Ukraine. The war disrupted the supply chains of many commodities that used to be supplied by both Ukraine and Russia, affecting the global stock market. Moreover, sanctions aiming to paralyse the Russian economy affected multiple economic sectors, causing an almost 10% plunge in the global stock market during the first week of the war. However, as the NATO alliance showed strong support for Ukraine, the stock market bounced back.</p> <h3>Natural factors</h3> <p>Natural disasters, such as tsunamis, floods, wildfires, and public health emergencies, like the infamous COVID-19 pandemic, can bring not only serious physical damage but economic damage as well. These events interrupt the production and distribution of goods and services, affecting global markets and bringing the prices of stock indices down. COVID alone, for example, sent the stock market into a free fall, causing the sixth-worst percentage price drop in history. However, in the long run, the pandemic has benefitted the tech industry, and tech-heavy indices have had significant growth which is reflected in their prices.<br /> <br /> Traders looking for index trading opportunities need to pay close attention to the news covering important events. However, this data can only indicate possible price movements, not a 100% accurate prediction. To create a holistic trading plan, it’s important to evaluate several factors consecutively and draw an informed conclusion.<br /> <br /> Moreover, market sentiment or public perception can often influence index prices more than anything else. Unfortunately, since it’s a subjective matter, it cannot be predicted in advance, but some traders use technical analysis to spot price movements caused by market sentiment. We’ll discuss technical analysis in one of our following articles.<br /> <br /> For now, let’s first see how you can trade indices with the information we have covered in this article. The good news is that when you trade indices with CFDs, you can capitalise on both rising and falling prices. Check out our <a href="/za/trading-academy/indices/how-to-trade-indices">How to trade indices</a> article to see how it works.</p>
How to Use the Forex Index Strategy in Trading
<p>The <strong>force index indicator</strong> is a technical tool used by traders to measure the power behind movements in the price action. It belongs to the family of oscillators. This strategy was first documented by Alexander Elder, a trader and psychologist, in his 1993 book titled <em>Trading for a living</em>.</p> <p>In this blog post, we look at the basics of the force index indicator, how it is calculated, how to interpret its readings, and we share with you a simple trading strategy.</p> <h2>How is it calculated?</h2> <p>The force index indicator is based on price action and volume. In essence, the indicator compares the current market price with a prior market price, and multiples it with a volume over the same period.</p> <p>Based on a formula shared below, the indicator measures the strength of price movements and generates signals of potential changes in the price direction.</p> <p>The <strong>formula</strong> for calculating the force index is as follows:</p> <p>FI(1)=(CCP − PCP)∗VFI(13)=13-Period EMA of FI(1)<br /> <br /> The elements of this formula are:<br /> <br /> <strong>FI</strong> = Force index<br /> <strong>CCP</strong> = Current close price<br /> <strong>PCP</strong> = Prior close price<br /> <strong>VFI</strong> = Volume force index<br /> <strong>EMA</strong> = Exponential moving average<br /> </p> <p>Almost all <a data-di-id="di-id-50880195-24d8837" href="https://www.thinkmarkets.com/en/trading-platforms/">trading platforms</a> nowadays have a built-in force index indicator, hence, you are not required to manually calculate the values. In <a data-di-id="di-id-6e0d35b7-1d3b3793" href="https://www.thinkmarkets.com/en/trading-platforms/mt5/">MetaTrader5</a>, you simply select the indicator from a drop-down menu of listed indicators, as shown in the picture below. The standard average, on which the force indicator is calculated, is 13 periods.</p> <p><img alt="" src="/TMXWebsite/media/TMXWebsite/Force-Index-pic-1.jpg" /></p> <p>Arguably the most important use of the force index indicator is to confirm breakouts and potential trend changes. It generates readings that inform the trader about the strength of a current move as values travel from a positive to a negative territory, and vice versa.</p> <p>An interesting characteristic of this indicator is that it has no bounds i.e. its values can travel up or down indefinitely. If the index goes above zero - a <em>rising force index</em> - it is confirming the rise in the price action. On the other hand, <em>a falling force index</em> generates values below zero and helps confirm a price action that is moving lower.</p> <p>In a picture below, you can see the applied indicator on a NZD/USD daily chart. The values travel from positive to negative territory as the index calculates the amount of power used to move the price action around.</p> <p><img alt="" src="/TMXWebsite/media/TMXWebsite/Force-Index-pic-2.jpg" /></p> <h2>Strengths and weaknesses</h2> <p>As said earlier, the force index measures the power deployed by sellers or buyers behind market movements. As such, the indicator is very effective as it practically verifies the legitimacy of a movement i.e. if the breakout is followed by a spike in the direction of a breakout it helps confirm the breakout. On the other hand, breakouts without high readings (lower volume) have a higher chance of ending up as false breakouts.</p> <p>The lower force index values are usually associated with the sideways price action, as volume is lower and price movements are not as sharp as during the breakouts. Thus, the force index readings spike in value during an uptrend and fall during downtrends.</p> <p>When it comes to the negative aspects of the force indicator, it shares the key weakness of all lagging indicators. Due to their inherent design, lagging indicators use prior price and volume data to calculate the readings. As such, they may be slow in generating signals.</p> <p>For instance, the force index indicator may confirm the breakout a few sessions after the price had broken out initially. Hence, you may be stuck waiting for confirmation while the price action has already travelled significantly in a certain direction.</p> <p>Trading the Force Index Indicator The role of the force index indicator in the trading process is very similar to <a data-di-id="di-id-6e6e2526-2f44eb08" href="https://www.thinkmarkets.com/en/trading-academy/indicators-and-patterns/stochastic-oscillator/">other oscillators</a> and lagging indicators. Given its design, the best way to use this technical tool is to see it as a tool for confirmation of the breakouts.</p> <p>The first step would be to perform a basic technical analysis and identify important price points from the perspective of supply and demand i.e. support and resistance. Once we have marked these levels on a chart, the base is set to monitor the price action closely, and wait for a potential breakout to the upside or downside to occur.</p> <p>Let’s see an example of how to use the force index <strong>to confirm sharp movements</strong> in the price direction. We have a AUD/USD daily chart below, whose price action we can divide into two parts. The left part of the chart is characterised by the sideways price movement, which generates values around zero.</p> <p>On the other hand, the right part of the chart is when the pair is moving sharply in both directions. As a result, the force index indicator is following the price movements up and down as well.</p> <p><img alt="" src="/TMXWebsite/media/TMXWebsite/Force-Index-pic-3_1.jpg" /></p> <p>The bulls fail in an attempt to push the price action higher above the horizontal resistance, which opens up the space for the sellers to secure a bigger move lower. This time, the second attempt from the sellers to push the price action to the downside is followed by a sharp decline in values of the force index indicator - falling force index - signalling that this time there is a significant force behind this move.</p> <p>Ultimately, the sellers get a move of around 1,000 pips lower. At the point where the second move lower was initiated, <em>the force index reading was at minus-85</em>.</p> <p>Entry (the blue line) should be placed at the point where it is obvious that the buyers failed to push above the horizontal resistance i.e. a change in the price direction is imminent. The stop loss is above the horizontal resistance, meanwhile we placed the take profit order where the first move lower was capped (the green line), as we have clear evidence that this level is a support now.</p> <p>Ultimately, <strong>we risked 105 pips to earn 155 pips</strong>, putting the risk-reward ratio at around 1:1.5, which is acceptable.</p> <h2>Summary</h2> <p>The <strong>force index</strong> is a technical indicator which is used to calculate the power behind movements in the price action. As such, the indicator is mainly used to confirm the breakouts and identify potential changes in the trend direction. It is based on the formula that compares the current market price with a prior market price, and multiples it with a volume over the same period.</p> <p>The force index indicator belongs to the family oscillators and generates values that can travel up or down indefinitely.</p>
What affects forex exchange rates?
<p>Financial markets' moves are difficult to predict. However, your chances of success are much higher when you understand how the markets work and what exactly affects the prices of financial instruments. Understanding these details can help you plan your trades strategically instead of randomly guessing your next step and hoping for good luck.<br /> <br /> When it comes to predicting currency exchange rates, it's important to understand that forex, like all financial markets, is heavily influenced by supply and demand. A decreasing supply paired with an increasing demand usually leads to rising prices. Similarly, an increased supply with decreased demand drives the prices down.<br /> <br /> Factors affecting supply and demand and, therefore, the exchange rate movements of every currency pair can vary depending on the main pillars of each country's economy. For example, Australian and Canadian economies rely on natural resources export, which affects the exchange rate of the Australian and Canadian dollar (AUD and CAD) against other currencies. On the other hand, the United Kingdom and the pound (GBP) are more sensitive to political developments and interest rate movements.<br /> <br /> Despite these differences, trading experts have identified the common factors affecting supply and demand on forex.<br /> <br /> <img alt="" src="/getmedia/f3d6d0f9-9b0d-468f-8431-0d3ee0757d1d/article-forex-what-affects-forex-rates.webp" /></p> <h2>Main factors affecting foreign exchange rates</h2> <h3>International trade</h3> <p>Trading activities between different countries directly affect the value of their currencies. When a country exports some goods, in many cases, a buyer pays for the products in the exporter's local currency. If a country's exports are higher than its imports, it creates a high demand for its currency and, as a result, increases its value.<br /> <br /> The amount of exports and imports of every country, in turn, depends on the country's needs and production structure. For example, the US and Brazil are long-term trading partners. Let's assume the US has been importing coffee from Brazil for USD 2 per kg, but suddenly Colombia offered a price of USD 1 per kg. If the US, one of the largest coffee importers, were to go for Colombian coffee instead of Brazilian because of more attractive import prices, it would decrease Brazilian exports significantly. As a result, the demand for the Brazilian real (BRL) and its exchange rate against a foreign currency, USD in this case, would also decline. At the same time, favourable export prices would increase demand for the Colombian peso (COP), strengthening it against USD.<br /> <br /> Some specific countries, like Australia and New Zealand depend strongly on exports, and there is a high correlation between the price of what they export and their currency. However, for most other large economies, the state of their trade balance has minimal impact on the currency exchange rate. This was not the case 30 or 40 years ago when capital restrictions limited capital flow. </p> <h3>Inflation</h3> <p paraeid="{94c33f92-f774-48ac-9997-dda5c9bbd5a4}{50}" paraid="2063613172">Inflation means a rise in prices of goods over time that leads to the decreasing purchasing power of a country's currency. For example. if inflation in the UK increases by 10% over a year, that means that the British Pound has dropped 10% in value compared to the year earlier. In terms of exchange rates, if inflation is at 2% in the USA, then the GBP/USD exchange rate should depreciate by 8% in favour of the US Dollar to compensate for the difference in inflation between the two countries. </p> <p paraeid="{94c33f92-f774-48ac-9997-dda5c9bbd5a4}{138}" paraid="1186889332">To track inflation rate changes, traders usually keep an eye on the Consumer Price Index (CPI) reports. Most countries release these reports monthly, except in Australia and New Zealand, which publish them quarterly. CPI is a widely considered measure of inflation because it tracks the percentage change in the price of a basket of goods commonly purchased by consumers. </p> <h3>Interest rates</h3> <p>High interest rates attract foreign capital to a country, promising foreign investors higher returns on their capital. With more investors entering the country's local market, the demand for its currency increases, driving its value higher. On the flip side, low interest rates make a country less attractive for foreign investment.<br /> <br /> Interest rates and inflation are directly correlated – growing inflation is usually followed by increasing interest rates as governments are trying to battle currency depreciation. This, in turn, strengthens the currency and affects exchange rates.<br /> <br /> In 2022 trading world witnessed a clear example of this process when the US Federal Reserve announced the sharpest interest rate hike since the 1980s, which resulted in the almost immediate US dollar strengthening while other currencies traded against it crashed.<br /> <br /> Experienced traders usually keep an eye on central banks’ interest rate decisions to find trading opportunities.</p> <h3>Economic indicators and political stability</h3> <p>Besides inflation and interest rates, it's worth watching Gross Domestic Product (GDP), which provides a snapshot of the economic conditions of a country, the balance of payments, government debt, the unemployment rate and other factors. All of them influence the country's currency value in one way or another. Traders are able to see a schedule of these releases in the economic calendar, which is a very popular tool for identifying potential trading opportunities.<br /> <br /> The number of different reports to check can get a little overwhelming for a new trader, but the good news is you don't have to check them all at once. Beginners tend to stick to the most important and self-explanatory ones. For example, GDP is the ultimate indicator of the economic health of any country. Fast GDP growth usually implies a strong economy and high demand for its currency, which in turn drives its price up.<br /> <br /> The political environment of a country also has a significant influence on its currency exchange rate. Similar to the low interest rates, political turmoil makes a country less appealing for foreign capital, resulting in a declining exchange rate of its currency.<br /> <br /> Both economic figures and political updates are usually heavily covered in the news, making news trading the most attractive trading strategy for beginners.<br /> <br /> Once you get more comfortable with the basic figures we discussed above, you can move on to an in-depth analysis of multiple numbers suggesting changes in exchange rates. Keep in mind that any of the factors mentioned above can rarely influence price movements on their own. A comprehensive approach requires comparing a few numbers and drawing a general conclusion based on your findings.</p> <h3>Market sentiment</h3> <p>In anticipation of a currency's rise or fall, many traders start buying or selling a currency before it changes its value. This, in turn, increases its demand or supply, resulting in price swings triggered solely by traders' activity. This factor is usually hard to predict as it depends only on the human factor and traders' perception of the upcoming events.<br /> <br /> This is where technical analysis with chart patterns and indicators come into play, which we will discuss in detail in our <a href="/en/trading-academy/what-is-technical-analysis-in-trading">Technical analysis in trading</a> blog.<br /> <br /> Before you dive deeper into analysing forex, it may be a good idea to practice your newly obtained knowledge on a <a href="/en/demo-account">risk-free demo account</a>. Our proprietary, award-winning trading platform ThinkTrader, for example, offers dozens of forex pairs and USD 10,000 of virtual money.</p>