 NZ
NZArticles (45)
ThinkTrader Web - TradingView User Guide
<p>ThinkTrader Web enters a new era with the integration of TradingView charts. TradingView’s intuitive and powerful charts are designed to aid you in making more informed trading decisions. These charts cater to all levels of experience, whether you’re a seasoned trader or just starting out.</p> <p>Discover ThinkTrader Web’s new charting interface, powered by TradingView, for a seamless and efficient way to monitor and analyse the markets.</p> <h3>What is TradingView? </h3> <p>TradingView is a cutting-edge trading chart provider that has revolutionised the way traders access market data. Globally known for its user-friendly interface combined with powerful analytical features, TradingView offers a comprehensive range of charting tools for better decision making.</p> <h3>How to access TradingView charts on ThinkTrader Web? </h3> <p>TradingView charts are fully integrated into ThinkTrader Web’s interface. To access the charts, all you need to do is log in on ThinkTrader Web. </p> <p>Don’t have an account yet? No problem. Simply head to ThinkPortal and open a new account.</p> <h3>TradingView features </h3> <p>As you log in to ThinkTrader Web, you will immediately get access to TradingView’s charting interface. Here are the key components and features that TradingView offers.</p> <h3>Chart types </h3> <p><img alt="" src="https://k13-dev.thinkmarkets.com/TMXWebsite/media/TMXWebsite/Picture1_1.png" /></p> <p>TradingView’s sleek chart windows are where you’ll spend most of your time analysing the markets. The chart window displays price movements in your chosen chart type. </p> <p>Choose from TradingView’s 13 chart types to complement your trading strategy: </p> <ul> <li>Bars </li> <li>Candles </li> <li>Hollow candles </li> <li>Columns </li> <li>Line </li> <li>Line with markers </li> <li>Step line </li> <li>Area </li> <li>HLC area </li> <li>Baseline </li> <li>High-low </li> <li>Heikin Ashi </li> <li>Renko </li> <li>Line break </li> <li>Kagi </li> <li>Point & figure </li> </ul> <h3>Time frames </h3> <p><img alt="" src="https://k13-dev.thinkmarkets.com/TMXWebsite/media/TMXWebsite/Picture2_1.png" /></p> <p>TradingView offers a versatile range of time frames, allowing traders to analyse market trends and patterns over various periods. Understanding these time frames effectively is crucial for both short- and long-term trading strategies.</p> <p>Located at the top of the TradingView chart window, click the button to open a dropdown menu for different time frames. This feature allows for quick and easy switching between various periods. TradingView offers a variety of options that you can maximise for better decision making.</p> <ul> <li lang="EN-US" paraeid="{e1e67508-3f48-4237-bbf4-e81fe81035b7}{122}" paraid="1900490906" xml:lang="EN-US">1 minute </li> <li lang="EN-US" paraeid="{e1e67508-3f48-4237-bbf4-e81fe81035b7}{126}" paraid="665826024" xml:lang="EN-US">5 minutes </li> <li lang="EN-US" paraeid="{e1e67508-3f48-4237-bbf4-e81fe81035b7}{130}" paraid="1545845398" xml:lang="EN-US">10 minutes </li> <li lang="EN-US" paraeid="{e1e67508-3f48-4237-bbf4-e81fe81035b7}{134}" paraid="428893242" xml:lang="EN-US">15 minutes </li> <li lang="EN-US" paraeid="{e1e67508-3f48-4237-bbf4-e81fe81035b7}{138}" paraid="1923105792" xml:lang="EN-US">30 minutes </li> <li lang="EN-US" paraeid="{e1e67508-3f48-4237-bbf4-e81fe81035b7}{142}" paraid="1102247723" xml:lang="EN-US">1 hour </li> <li lang="EN-US" paraeid="{e1e67508-3f48-4237-bbf4-e81fe81035b7}{146}" paraid="61749682" xml:lang="EN-US">4 hours </li> <li lang="EN-US" paraeid="{e1e67508-3f48-4237-bbf4-e81fe81035b7}{150}" paraid="200973453" xml:lang="EN-US">1 day </li> <li lang="EN-US" paraeid="{e1e67508-3f48-4237-bbf4-e81fe81035b7}{154}" paraid="129446316" xml:lang="EN-US">1 week </li> <li lang="EN-US" paraeid="{e1e67508-3f48-4237-bbf4-e81fe81035b7}{158}" paraid="1655478611" xml:lang="EN-US">1 month </li> </ul> <p>The choice of time frame should align with your trading style and strategy. Short-term traders might prefer minute or hourly charts for quick trades, while long-term traders may opt for daily or weekly charts to understand longer-term trends. </p> <h3>Drawing tools </h3> <p><img alt="" src="https://k13-dev.thinkmarkets.com/TMXWebsite/media/TMXWebsite/Picture3_1.png" /></p> <p>Situated at the side of the chart window, this toolbar contains an extensive set of drawing tools. These tools are crucial for chart mark-ups, trend analysis, and pattern identification. Here's an overview of what you can expect and how to use them:</p> <p>Located on the left side of the chart window, the side toolbar features various icons. Each icon represents a different drawing tool or function. </p> <p>Types of drawing tools available on ThinkTrader Web:</p> <ul> <li lang="EN-US" paraeid="{cba26489-6615-4d0f-ae16-b5f65ce0b2b9}{68}" paraid="519850178" xml:lang="EN-US">Trend lines and arrows - essential for identifying and marking trend directions </li> <li lang="EN-US" paraeid="{39836a35-0514-4a22-ad62-c2a20153ac60}{121}" paraid="227503749" xml:lang="EN-US">Geometric shapes - useful for highlighting key chart areas or patterns like triangles, rectangles, and circles </li> <li lang="EN-US" paraeid="{657fe92a-fa54-41a8-b95d-ec5727fc040e}{12}" paraid="218871322" xml:lang="EN-US">Fibonacci tools - these include retracement, extension tools, and circles for understanding potential support and resistance levels </li> <li lang="EN-US" paraeid="{657fe92a-fa54-41a8-b95d-ec5727fc040e}{192}" paraid="1147681384" xml:lang="EN-US">Drawing tools - text and emoticons for adding notes directly on your chart </li> <li lang="EN-US" paraeid="{832c159a-f00e-4113-81a4-417dabdc699a}{97}" paraid="1476881051" xml:lang="EN-US">Customisation - Each tool comes with customisation options. Right-click on a drawn object to change the colour, thickness, and style </li> </ul> <p>All your drawn elements can be easily edited, moved, or deleted. You can also clone or lock them in place for more detailed analysis. Traders often practice drawing trend lines to connect significant highs and lows and use geometric shapes to identify chart patterns. </p> <h3>Indicators and Strategies </h3> <p><img alt="" src="https://k13-dev.thinkmarkets.com/TMXWebsite/media/TMXWebsite/Picture4-(1).png" /></p> <p>TradingView boasts a comprehensive range of powerful technical indicators and strategies. Traders consider indicators as vital tools that offer deep insights into market trends and potential trading opportunities. </p> <p>To access the list of indicators, click on the ‘Indicators’ button located at the top toolbar. This will open a window showcasing a wide range of available indicators. </p> <p><strong>Types of indicators available: </strong></p> <ul> <li lang="EN-US" paraeid="{ef91d53e-af02-45bb-ada7-31b5e7bd31e2}{1}" paraid="201540585" xml:lang="EN-US">Trend indicators - such as Moving Averages, Bollinger Bands, and MACD help identify the market trend </li> <li lang="EN-US" paraeid="{255c9261-bc76-4423-810b-c108bf45a7f8}{155}" paraid="622257580" xml:lang="EN-US">Momentum indicators – such as the RSI and Stochastic Oscillator indicate overbought or oversold conditions </li> <li lang="EN-US" paraeid="{2c1eae90-835f-4670-9106-b0618e63b58b}{44}" paraid="1992357696" xml:lang="EN-US">Volume indicators – such as Volume Oscillator and On-Balance Volume provide insights into trading volume and market strength </li> <li lang="EN-US" paraeid="{4685afcb-e3c3-480c-8dbb-6935a5e69294}{171}" paraid="1496369134" xml:lang="EN-US">Volatility indicators – such as ATR and Bollinger Bands give an idea about market volatility </li> </ul> <p lang="EN-US" paraeid="{7c58c32e-ad72-4904-942c-9748ed6d60f6}{72}" paraid="666409873" xml:lang="EN-US">To apply an indicator, simply select your desired indicator from the list. You can customise its parameters and appearance according to your trading style. </p> <p lang="EN-US" paraeid="{50db5711-d709-4538-b92f-df4c05ad377f}{82}" paraid="1420725562" xml:lang="EN-US">TradingView also allows multiple indicators to be applied on the same chart. This offers a more comprehensive analysis to validate trading signals. Once you've set up an indicator, you can save these settings for future use, ensuring consistency in your analysis.</p> <h3>Bottom toolbar</h3> <p lang="EN-US" paraeid="{5253e938-9b7e-451a-ba5a-dec57eb029f3}{218}" paraid="269356383" xml:lang="EN-US">The bottom toolbar on TradingView offers multiple features essential for market analysis.</p> <p> </p> <p><img alt="" src="https://k13-dev.thinkmarkets.com/TMXWebsite/media/TMXWebsite/Picture5-(1).png" /></p> <p>Time scale adjustments – this feature lets you modify the time scale of the chart, which is useful for viewing market movements over different periods. This can range from minute-by-minute changes to broader historical trends.</p> <p><img alt="" src="https://k13-dev.thinkmarkets.com/TMXWebsite/media/TMXWebsite/Picture6-(1).png" /></p> <p>Date range selection: Easily select and view a specific date range on your chart. This is useful for focusing on a particular period of interest, like post-announcement effects or during significant economic events.</p> <h3 lang="EN-US" paraeid="{5253e938-9b7e-451a-ba5a-dec57eb029f3}{218}" paraid="269356383" xml:lang="EN-US">Multi-chart display</h3> <p lang="EN-US" paraeid="{5253e938-9b7e-451a-ba5a-dec57eb029f3}{218}" paraid="269356383" xml:lang="EN-US"><img alt="" src="https://k13-dev.thinkmarkets.com/TMXWebsite/media/TMXWebsite/Picture7-(1).png" /></p> <p>TradingView on ThinkTrader Web offers a multi-chart display feature that allows traders to simultaneously monitor up to 8 different instruments.</p> <p>Click the layout button located on the top toolbar to open a dropdown menu with options of different chart layouts. These range from a single chart view to multiple chart layouts, allowing you to view up to 8 charts simultaneously.</p> <p>To set up a multi-chart display, choose your preferred layout, depending on how many markets you wish to track at once. You can display different instruments or timeframes on each chart so you can compare multiple markets or strategies in real-time.</p> <p>Within the multi-chart layout, each chart can be customised independently. Apply different indicators, drawing tools, and timeframes to each chart based on your trading strategy. This flexibility is perfect for traders who monitor correlations between different instruments or need to keep an eye on various segments of the market simultaneously.</p> <p>However, TradingView also offers the convenience of synchronisation. You can sync tools, drawings, and indicators across all charts in your layout. This ensures consistency in your analysis and saves time, especially when comparing similar markets.</p> <h3>TradingView on ThinkTrader Web</h3> <p lang="EN-US" paraeid="{5253e938-9b7e-451a-ba5a-dec57eb029f3}{218}" paraid="269356383" xml:lang="EN-US">ThinkTrader provides traders access to thousands of instruments across global financial markets, such as forex, stocks, indices, cryptocurrencies, commodities, ETFs, and futures. Level up your trading by maximising TradingView’s powerful features and ThinkMarkets’ excellent trading conditions today.</p> <p>If you have any questions regarding TradingView and ThinkTrader Web, our 24/7 client support team is available via live chat, email, or phone, and can support in 20+ languages.</p> <p> </p> <p> </p>

What is a micro lot in forex? Calculate & trade micro lot size
<p>A micro lot in forex represents 1,000 units of the base currency. Micro lot trading allows new traders with small accounts to experience the market without the high risk and psychological stress of handling larger positions.</p> <p>But whether micro lots suit your needs depends on more than just account size and tolerance for risk. It also depends on your goals and experience. Some beginner traders use a micro account in forex to manage risk in volatile times, while others do so to test new trading strategies.</p> <p>At ThinkTrader, you can start trading micro lots in forex with a ThinkMarkets account from just $50. Trading micro lots is straightforward with a platform that provides an intuitive order interface, built-in position sizing calculators, and powerful risk management tools.</p> <p>But in this guide, you will learn more than just that. We will go over:</p> <ul> <li>How much is a micro lot in forex to help you get a head start</li> <li>Calculating micro lot size and pip value</li> <li>When to trade with micro lots in forex</li> <li>How micro lots help with risk management</li> <li>When is the best time to scale forex trading micro lots</li> <li>How to trade micro lots on ThinkMarkets</li> </ul> <p>Before we compare all the available forex trading lot sizes, let's define micro lots clearly.</p> <p><br /> <strong>Ready to start trading micro lots? Sign up for a <a href="https://www.thinkmarkets.com/en/thinktrader-account/">ThinkTrader account</a> here.</strong></p> <h2>What is a micro lot in forex?</h2> <p>A micro lot in forex is the smallest unit of the three standardised contract sizes, equalling a micro lot movement of one pip. Micro lot trading enables forex traders to trade the forex market with considerably lower exposure than the other two lot sizes allow: the standard lot and mini lot.</p> <p>The decision to trade with forex micro lots often reflects the reality of beginner traders, who prefer to start small and scale as they learn. Brokers with micro accounts meet this need by providing micro accounts, which enable traders to deposit as little as $50 or less. The minimum lot size in forex for most brokers is typically the micro lot (0.01), though some offer even smaller nano lots.</p> <p>Trading micro lots may offer reduced exposure, but it also keeps profit and loss swings small. Understanding what is micro trading can help beginner traders recognise that it's not just about smaller positions but also about strategic risk management and learning.</p> <p>For example, a typical 100 pip daily fluctuation on the EURUSD pair with 1 micro lot would change your P&L by around $10, be it on the winning or losing side. An easier way to think of this is to consider 1,000 units as 1,000 cents, which equals $10.</p> <p><img alt="" src="/getmedia/9006c84c-4e2a-4e0c-a5fe-4ef57b2cd16b/Academy-Forex-Micro-lot-pip-value-usd.png" /></p> <div style="text-align: center;"> <span style="text-align: center;">Micro lot pip value ($)</span></div> <h2>How much is a micro lot in forex trading?</h2> <p>A micro lot is exactly 1,000 units of the base currency, or 1% of the trade size of a standard lot. How much is 1 micro lot in forex? On <a href="https://www.thinkmarkets.com/en/trading-academy/forex/what-affects-forex-exchange-rate/">forex trading</a> platforms, this is usually listed as 0.01. One standard lot is shown as 1.00 and represents 100,000 units of the base currency, while mini lots are shown as 0.1 and are worth 10,000 units.</p> <p>The pip value of forex micro lots is 10 to 100 units smaller compared to the larger position sizes. For currency pairs where USD is the quote currency, a micro lot has a pip value of $0.1, whereas a one-pip movement in a standard lot size has a value of $10. This means that for every micro pip movement in the exchange rate of a currency pair, the value of your forex position changes by 10 cents.</p> <p style="text-align: center;"><img alt="" src="/getmedia/534d157a-17a2-4783-addc-788e04cea29a/Academy-Forex-Forex-lot-size-explained-in-units-volume-and-pip-value.png" /> Forex lot size explained in units, volume and pip value</p> <p>Let’s see how the pip value of a forex micro lot is calculated exactly.</p> <h2>Calculating a micro lot size in forex trading</h2> <p>To calculate lot size and the exact pip value of a micro lot, you need the current exchange rate between your account currency and the quote currency in your trade. A micro lot calculator can help automate these calculations for faster position sizing.</p> <p>The formula is:</p> <p><img alt="" src="/getmedia/a28d1b0e-e605-4c01-8283-1a11d55f2aa1/Academy-Forex-pip-value-formula.png" /></p> <p>When the quote currency and your account currency are the same, the pip value is equal to the price changes in your traded instrument. If your account currency is USD, then 1 pip is worth $0.10, and your account statement will show this same value.</p> <h3>EUR/USD micro lot pip example</h3> <p>For EURUSD, the forex pip calculation is simple. Since the quote and account currencies are the same, the exchange rate between the two is not considered.</p> <p><strong>Instrument: EUR/USD</strong></p> <ul> <li><strong>Account currency:</strong> USD</li> <li><strong>Quote currency:</strong> USD</li> <li><strong>Lot size:</strong> 0.01 forex lot (1,000 units)</li> <li><strong>Pip size:</strong> 0.0001</li> <li><strong>Pip value</strong> = 0.0001 × 1,000 = $0.10 per pip</li> <li><strong>50-pip move</strong> = $5 profit or loss per micro lot</li> </ul> <p>Using the formula above, we get:</p> <p style="text-align: center;"><strong>Pip Value = Pip Size (0.0001) × Units (1,000) = $0.10 per pip</strong></p> <p><img alt="" src="/getmedia/3db128c4-d7dd-4f12-99bf-dc0dcf51a10a/Academy-Forex-Micro-lot-pip-value-equals-10-cents-in-EURUSD.png" /></p> <div style="text-align: center;"> <span style="text-align: center;">Micro lot pip value equals 10 cents in EURUSD</span></div> <p>However, when your account currency is different from the quote currency, you have to calculate pips by factoring in the current exchange rate.</p> <p>Let’s see how it works with the following USDJPY example.</p> <h3>USD/JPY micro lot pip example</h3> <p>JPY pairs quote pips at two decimal places (0.01). For a 0.01 lot, and taking the current exchange into account, the pip value is 10 JPY (~$0.07). However, the value of a forex pip can change over time as the USDJPY rate fluctuates.</p> <p>For example, a 50-pip move is about $3.35 (50 x $0.0667) at an exchange rate around 150.00.</p> <p>Here is how that’s reflected using our formula:</p> <p style="text-align: center;"><strong>Pip Value (USD) = (Pip Size (0.01) × Units (1,000)) ÷ USDJPY (150) = $0.0667 per pip</strong></p> <p>Now, let’s consider <a href="https://www.thinkmarkets.com/en/trading-academy/commodities/what-is-gold-trading-why-trade-gold/">gold</a>, which uses the dollar as the quote currency. It works similarly, even though gold is a precious metal.</p> <h3>XAU/USD (Gold) micro lot pip example</h3> <p>A position of 1 standard lot on gold equals 100 troy ounces, so 1 micro lot (0.01) simply equals 1 troy ounce of gold. Thus, the minimum position size you can enter on gold is 1 troy ounce. Taking the current price around $3,500, this is the minimum position value you can hold on <a href="https://www.thinkmarkets.com/en/trading-academy/commodities/how-to-trade-gold-a-short-guide/">gold</a>.</p> <p>If the minimum price increment in gold (XAU/USD) is $0.01, then a $0.01 move equals $0.01 per micro lot. A $1.00 move in the <a href="https://www.thinkmarkets.com/en/trading-academy/commodities/gold-trading-strategy-for-2025/">price of gold</a> will equal $1.00 per micro lot.</p> <p>Using the same formula, we get:</p> <p style="text-align: center;"><strong>Tick Value (USD) = Tick Size ($0.01) × Ounces per micro lot (1) = $0.01</strong></p> <p>For traders who want to use advanced tools to help with these calculations, a pip forex calculator or FX pip calculator can automatically compute pip values across different currency pairs and lot sizes.</p> <p>Now that you know how to calculate a micro lot, let's also take a deeper dive into the other types of lots in <a href="https://www.thinkmarkets.com/en/trading-academy/forex/what-is-forex-trading/">forex trading</a>.</p> <p><strong>Have your own gold trading strategy? Access a <a href="https://www.thinkmarkets.com/en/thinktrader-account/">micro lot account</a> with only $50.</strong></p> <h2>Micro and other types of lots for forex traders</h2> <p>Forex lot sizes are defined in fixed contracts, which represent how many units of the base currency you are <a href="https://www.thinkmarkets.com/en/trading-academy/forex/order-types/">buying or selling</a>. The forex minimum lot size varies by broker but typically starts at the micro lot level.</p> <p>In <a href="https://www.thinkmarkets.com/en/forex-trading/">forex trading</a>, there are three standardised lot sizes - standard lot, mini lot, micro lot - as we have already mentioned, suitable for different traders:</p> <ul> <li><strong>Standard lot</strong></li> <li><strong>Mini Lot</strong></li> <li><strong>Micro Lot</strong></li> </ul> <p>The relationship between these is simple: standard, mini, micro lot sizes follow a 100:10:1 ratio. Here’s a forex lot size chart to visualise the differences between lot sizes.</p> <p><img alt="" src="/getmedia/7d9d7684-cb11-42a0-b9cd-51a219ad2dd1/Academy-Forex-Comparison-table-of-micro-mini-and-standard-lot-sizes-in-forex-trading.png" /></p> <div style="text-align: center;"> <span style="text-align: center;">Comparison table of micro, mini, and standard lot sizes in forex trading</span></div> <h2>Main differences between a micro lot and mini and standard lots</h2> <p>Standard, mini, and micro lots can all be traded from the same account on the same markets and with the same instruments. However, the differences in capital requirements and risk profile implications are huge.</p> <p>Let’s go over each of them to see why understanding how they impact your account is crucial.</p> <h3>Micro account capital requirements</h3> <p>The amount of capital required for each lot size in forex trading depends on your risk rules, the typical <a href="https://www.thinkmarkets.com/en/thinktrader/thinktrader-introduces-trailing-stop-loss-feature-for-advanced-risk-management/">stop distance</a>, the volatility of the assets you trade, and the leverage assigned to your account. Forex trading with small capital often requires starting with micro lots to maintain proper risk management.</p> <p>In practice, standard lots are often used by traders with larger balances (e.g., $5,000+), mini lots by those with mid‑sized balances ($500–$5,000), and micro lots by traders with smaller balances (sub $500) who want lower per‑pip exposure. This is particularly important when choosing between different forex account types.</p> <p>Now, each of these scenarios has a different effect on your risk profile.</p> <h3>Risk management profile differences</h3> <p>Each step up in the lot size multiplies your dollar movement per pip. A standard lot vs micro lot comparison shows that standard lots carry the highest exposure (about $10 per pip on FX pairs), so your nominal profit/loss swings are larger. Mini lots sit in the middle at roughly $1 per pip, while micro lots give the smallest exposure at around $0.10 per pip.</p> <p>To put it all in context, a 50‑pip move against you in EURUSD is $500 on a standard lot, $50 on a mini lot, and $5 on a micro lot. This is why many traders prefer trading with smaller lots when starting out. What is the lowest lot size in forex? For most brokers, it's the micro lot at 0.01, making it the best lot size for beginners.</p> <h2>When to trade a micro lot size in forex</h2> <p>Choosing to trade a micro lot size depends on your trading goals and objectives, trading experience, and risk tolerance. You can use the risk profile above as your guide, then match the size with your trading plan. For those particularly interested in micro trading or micro <a href="https://www.thinkmarkets.com/en/trading-academy/forex/how-to-trade-forex/">forex trading</a>, knowing when to use these smaller positions is paramount.</p> <p><img alt="" src="/getmedia/32bb2fa8-1002-4e6e-bd6c-1c14f8d9c31f/Academy-Forex-When-to-trade-micro-lots-in-forex.png" /></p> <div style="text-align: center;"> <span style="text-align: center;">When to trade micro lots in forex</span></div> <p>Use micro lots when:</p> <ul> <li>You’re <strong>new to micro forex</strong> because lower per‑pip exposure helps you learn without large P/L swings.</li> <li>You’re <strong>trading a small balance</strong> (e.g., sub $500) and want tighter dollar risk per trade.</li> <li>You’re <strong>testing or <a href="https://www.thinkmarkets.com/en/traders-gym/">refining a strategy</a></strong> in live markets before allocating more capital.</li> <li>You need to <strong>scale in and out of trades</strong> or to fit wider stops and more volatile instruments while keeping risk within your comfortable limits.</li> <li>You need to <strong>manage correlated exposure</strong> across multiple positions without exceeding your risk thresholds.</li> </ul> <p>If you are unsure which forex trading lot size is right for you, keep your percentage risk fixed and test each size in a ThinkMarkets demo account. The results will show you exactly what level of risk you are comfortable with.</p> <p>Lot size choice is the first part of managing risk. The other part is understanding how leverage and margin work in practice, because they influence how you are exposing your account to risk.</p> <p><strong>Not sure which lot size is right for you? Practise with a <a href="https://www.thinkmarkets.com/en/demo-account/">ThinkMarkets demo</a> account.</strong></p> <h2>How leverage and margin affect micro lot positions</h2> <p>Leverage and margin allow you to open a micro lot forex position while providing only a fraction of its full value. Understanding the best leverage for micro account trading is so important for <a href="https://www.thinkmarkets.com/en/trading-academy/cfds/risk-management-tools-in-cfd-trading/">risk management</a>. With 100:1 leverage, you can control a $1,000 position with only $10. This small fraction is the margin, while the ratio between it and the nominal value is your leverage ratio.</p> <p>Here is the formula:</p> <p><img alt="" src="/getmedia/b83992d6-f9df-41da-bd0e-24ce3f2fd8e0/Academy-Forex-How-leverage-and-margin-affect-micro-lot-positions.png" /></p> <p>With micro lots, leverage can reduce margin to only a few dollars. This is how it works in practice on EURUSD at 1.05:</p> <p><img alt="" src="/getmedia/b08c4043-6089-4ad3-8a98-3f2b3e3b5a30/Academy-Forex-Required-leverage-and-margin-for-1-micro-lot.png" /></p> <div style="text-align: center;"> <span style="text-align: center;">Required leverage and margin for 1 micro lot</span></div> <p>The combination of higher leverage and lower margin can tempt overexposure, although your real risk comes from stop-loss distance and pip value. Even a micro lot forex position can produce large losses if the stop is wide or you stack multiple trades that go against you.</p> <p>For instance, at 500:1 leverage, a 1,000-unit EUR/USD position needs only around $2 in margin, but that leaves $98 to open additional positions. And you will still be fully exposed to the original position of 1,000 euros.</p> <p>To avoid getting trapped in the psychological traps of leverage and margin, you need a strategic approach to risk management. There are primarily two position sizing methods that help keep risk within acceptable limits.</p> <h2>Position sizing strategies to trade forex micro lots</h2> <p>Micro lots shine for precise position sizing because they let you dial in your exact risk without jumping to trading a standard lot, the largest lot size, ahead of time. The micro account lot size flexibility allows for precise risk management through the smallest price movements. Two approaches keep your risk consistent, no matter how, and trading conditions change:</p> <p><strong>1. The percentage-based approach</strong></p> <p><strong>2. The fixed amount approach</strong></p> <p>Let’s break down how each of them works.</p> <h3>1. Percentage-based risk approach</h3> <ul> <li>Determine your risk % per trade (e.g., 1% of your account)</li> <li>Determine your stop-loss in pips</li> <li>Calculate the lot size to achieve the desired percentage risk</li> </ul> <p>Here’s the formula:</p> <p><img alt="" src="/getmedia/e7b4a973-56ad-4e63-a415-5b95ab3f0122/Academy-Forex-Calculate-percentage-based-risk-approach.png" /></p> <p><strong>Example:</strong> for a $1,000 account, risking 1% with a 50-pip stop-loss:</p> <p><strong>Lot Size = ($1,000 × 0.01) / (50 × $0.10) = 0.02 lots</strong></p> <h3>2. Fixed amount approach</h3> <ul> <li>Decide on a fixed dollar amount you are willing to risk per trade</li> <li>Calculate the lot size based on the distance of your stop-loss</li> </ul> <p>Here’s the formula:</p> <p><img alt="" src="/getmedia/e5fe72ea-219c-4294-b9c2-c516c1c6890a/Academy-Forex-Caluclate-fixed-amount-risk-approach.png" /></p> <p><strong>Example:</strong> To risk $10 on a trade when your stop-loss is 50-pips:</p> <p><strong>Lot Size = $10 / (50 × $0.10) = 0.02 lots</strong></p> <p>Both methods keep risk consistent. The percentage approach is more adaptable as your account grows, while the fixed-dollar method offers simplicity.</p> <p>Now that you understand the basic micro lot position sizing strategies, it’s time to put them into use. At ThinkMarkets, you will have access to an intuitive platform, top-notch analysis tools, and industry-leading risk management features.</p> <h2>Start trading micro lots on ThinkMarkets</h2> <p>Let’s walk through the process of trading micro lots on ThinkMarkets step by step:</p> <h3>Step 1: Register for a ThinkMarkets trading account</h3> <p>Create a <a href="https://www.thinkmarkets.com/en/account-types/">ThinkMarkets account</a> and choose your account type from the available forex trading account types:</p> <ul> <li>Standard</li> <li>ThinkZero (raw spreads)</li> <li>ThinkTrader ($50 deposit)</li> </ul> <p>ThinkMarkets is one of the leading micro account forex brokers and best micro account brokers offering competitive conditions for small-scale traders.</p> <h3>Step 2: Open the charts on the broker trading platform</h3> <p>After funding your account, you can start trading through one of ThinkMarkets' trading platforms:</p> <ul> <li>ThinkTrader – proprietary platform integrated with TradingView</li> <li>MetaTrader 4</li> <li>MetaTrader 5</li> </ul> <p>Log in to and open a chart for your desired currency pair or instrument.</p> <h3>Step 3: Analyse the market and select a forex pair</h3> <p>Identify potential trading opportunities using <a href="https://www.thinkmarkets.com/en/trading-academy/technical-analysis/definition-charts-and-strategy-method/">technical</a> and <a href="https://www.thinkmarkets.com/en/trading-academy/forex/fundamental-analysis-definition-drivers-and-trading-methodology/">fundamental analysis</a>. Review the <a href="https://www.thinkmarkets.com/en/trading-academy/market-events/how-to-use-the-thinkmarkets-economic-calendar/">economic calendar</a> daily and define your trading plan for the chosen FX instrument.</p> <h3>Step 4: Choose lot size (0.01) in ThinkTrader or MT4/MT5</h3> <p>To place your order:</p> <ul> <li>1. Click the "Buy" or "Sell" button next to the instrument in the watchlist</li> <li>2. In the volume field, enter "0.01" for a micro lot</li> <li>3. Select your order type (market, limit, or stop)</li> </ul> <h3>Step 5: Set stop-loss and take-profit levels</h3> <p>Placing stop-loss and take-profit orders remains a crucial risk management step:</p> <ul> <li>1. Set your stop-loss at a level determined by your analysis and risk tolerance</li> <li>2. Set your take-profit at a level that provides a favourable risk-to-reward ratio (at least 1:2)</li> <li>3. Consider using trailing stops to protect potential profits as the trade moves in your favour</li> </ul> <h3>Step 6: Use a position size calculator to calculate lot size risk</h3> <p>ThinkTrader includes a built-in trading calculator to help you determine the appropriate micro lot size for a trade:</p> <ul> <li>1. Determine your acceptable risk per trade (typically 1-2% of your account)</li> <li>2. Enter your stop-loss distance in pips</li> <li>3. The calculator will recommend the appropriate lot size</li> </ul> <h3>Step 7: Monitor pip value relative to your account balance</h3> <p>After entering your trade, monitor its performance:</p> <ul> <li>1. Track the pip value fluctuations in relation to your account balance</li> <li>2. Ensure the position's fluctuations remain within your risk comfort zone</li> <li>3. Consider moving the stop-loss level when the trade moves in your favour</li> </ul> <p>Now that you know how to place micro lot forex trades and how they work in practice, it’s worth weighing up the advantages and limitations.</p> <p><strong><a href="https://www.thinkmarkets.com/en/thinktrader-account/">Start trading micro lots</a> on ThinkMarkets and put the position sizing strategies into action today!</strong></p> <h2>Pros and cons of trading with micro forex lots</h2> <p>Micro lots make forex more accessible and flexible, but they come with both benefits and limitations. Here’s a balanced look to help you decide when they may fit your needs. When comparing forex micro accounts vs standard accounts, consider these factors:</p> <p><img alt="" src="/getmedia/eaa68554-616e-4ae8-8fd8-61134aab5594/Academy-Forex-Micro-trading-pros-and-cons.png" /></p> <div style="text-align: center;"> <span style="text-align: center;">Micro trading pros and cons</span></div> <h3>Micro lots trader advantages</h3> <ul> <li><strong>Lower risk exposure:</strong> With pip values around $0.10, market swings translate into modest gains or losses, giving you space to practise without heavy losses.</li> <li><strong>Capital efficiency:</strong> You can start live trading with a modest account (e.g., as low as $500) without fearing that your balance will be at risk from normal <a href="https://www.thinkmarkets.com/en/trading-academy/forex/day-trade/">day-to-day</a> price fluctuations.</li> <li><strong>Flexible position sizing:</strong> Adjust in 0.01 lot increments to match the exact risk level you want for a certain position.</li> <li><strong>Psychological benefits:</strong> Smaller profit/loss fluctuations reduce stress, which can improve decision‑making and trade execution.</li> <li><strong>Live testing with limited risk:</strong> Trade forex micro lots to validate a new <a href="https://www.thinkmarkets.com/eu/trading-academy/forex/popular-forex-trading-strategies/">strategy</a>. Evaluate entry, exit, and trade management rules in real conditions. Scale up once the results prove your strategy.</li> </ul> <h3>Micro lots trader limitations</h3> <ul> <li><strong>Limited profit potential:</strong> Small pip values translate into small gains on winning trades. You will need more time and more trades to grow your account while trading with micro lots.</li> <li><strong>Risk of overtrading:</strong> When losses feel trivial, it can be tempting to add more trades without proper setups. A written <a href="https://www.thinkmarkets.com/TMXWebsite/media/TMXWebsite/10-tips-to-successful-trading-pdf.pdf">trading plan</a> can help maintain quality over quantity in your trading.</li> <li><strong>Not ideal for larger accounts:</strong> Traders with significant capital often require mini or standard lots to reach return goals.</li> </ul> <h2>Is micro lot trading in forex right for you?</h2> <p>Micro lot trading in forex could be right for you if you only have a small amount to start with. The forex micro account lot size flexibility makes it ideal for beginners and those testing strategies. If you are at a more advanced level, forex micro lots can help with testing strategies or prioritising tight risk control. Understanding what is a micro account in forex lets you decide if this approach aligns with your trading goals. However, when you have reached a point where your goal is achieving higher returns, it might be time to explore larger lot sizes.</p> <p>For traders seeking higher exposure for the potential of higher returns, mini lots or standard lots are the way to go. You can scale up once you have achieved consistent results trading forex with micro lots or once you have a larger account size of at least $500 for mini and $5000 for standard. In either case, the potential for higher returns comes with a high risk of loss. Veteran traders have strong risk management systems in place to keep potential drawdowns or losses in check.</p> <p><strong>Still unsure of your strategy? Refine it for free and risk-free on <a href="https://www.thinkmarkets.com/en/traders-gym/">Traders Gym</a>!</strong></p> <p> </p> <p> </p>
Forex hedging: Definition, risk strategies & FX examples
<p>Forex hedging is a risk management strategy that protects a portfolio from losses with new positions that move in the opposite direction of existing ones. While hedging in forex can incidentally produce gains, the primary goal is to hedge currency risk, not make a profit.</p> <p>The benefits of forex hedging for a diversified portfolio are well-recorded. For instance, a 2010 working paper from the International Monetary Fund (IMF) found that hedging a currency exposure reduced volatility in foreign investments substantially. However, forex hedging carries higher trading costs, particularly for frequent direct hedges where spread costs can compound.</p> <p>At ThinkMarkets, we offer raw 0.0-pip spreads on major FX pairs through ThinkZero accounts available on ThinkTrader. The trading platform allows you to open and close hedging positions automatically and monitor your net exposure in real time, making it straightforward to implement forex hedging strategies.</p> <p>What you’ll learn in this guide:</p> <ul> <li>Forex hedging meaning, when to hedge, and how currency risk management fits your trading plan.</li> <li>Hedging instruments in forex (derivatives) and the costs: spreads, swaps, commissions and slippage.</li> <li>Three FX hedging strategies: direct hedge, cross hedge and correlated‑pair hedge, with simple hedge‑ratio sizing.</li> <li>A step‑by‑step setup and a worked forex hedging example, plus common mistakes to avoid.</li> </ul> <p>Let’s begin by defining what forex hedging is and how it differs from speculative trading.</p> <p><strong>Open your ThinkZero account and take advantage of 0.0 spreads on FX majors.</strong></p> <h2>What is Forex hedging?</h2> <p>Forex hedging is a method to neutralise portfolio fluctuations by entering a counter-position in a currency pair that will gain value as your initial position starts to lose value. A hedge in <a href="/en/trading-academy/forex/what-is-forex-trading/">forex</a> involves going long and short on the same or different currency pairs to offset losses. Imagine going both long and short on the EURUSD forex pair at the same time to hedge risk.</p> <p><img alt="FX hedging eurusd (ThinkMarkets)" src="/getmedia/01408ff0-0282-4fc8-a19a-2880cbec4487/Academy-Forex-EURUSD-Forex-hedge-example.png" /></p> <p style="text-align: center;">EURUSD Forex hedge example</p> <p>Hedging <a href="/en/trading-academy/cfds/risk-management-tools-in-cfd-trading/">forex risk</a> is essential for traders who want to manage volatility and protect their capital. The goal isn’t to make gains but to reduce losses from potential negative price moves while keeping the original position open.</p> <p>Before we go deeper into how hedging in forex works, it’s useful to contrast it with speculation.</p> <h3>Difference between FX hedging and speculation</h3> <p>The key distinction between hedging and speculation lies in their impact: hedging offsets existing exposure to reduce volatility and drawdowns, whereas speculation creates new risk in pursuit of returns. A speculator judges success by profit versus risk taken. A hedger judges success by how much variability and downside were reduced relative to the plan.</p> <p>The next question is whether hedging in forex makes sense for you and when it adds more value than it costs.</p> <h3>Who hedges FX risk in Forex and why</h3> <p>There are many different players who are hedging FX risk in forex, but their objectives and tools differ. Here is a brief overview of the key market participants that extensively use forex hedging strategies:</p> <ul> <li><strong>Multinational corporations</strong> protect foreign exchange revenues, budgets and margins from FX swings, typically with forward contracts and, where available, options.</li> <li><strong>Importers and exporters</strong> lock exchange rates on receivables/payables to stabilise pricing on cross‑border transactions.</li> <li><strong>Asset managers and funds</strong> reduce currency “noise” in global portfolios so underlying asset decisions drive returns.</li> <li>Banks and financial institutions manage trading‑book and client exposures, and meet risk‑control mandates.</li> <li><strong>Retail forex traders</strong> cushion event risk, overnight/weekend gaps, and smooth equity curves without abandoning a <a href="/en/trading-academy/forex/how-to-trade-forex/">trade idea</a>.</li> </ul> <p>Understanding who hedges and why sets the basis. The next step is what this means for you as an active trader: why, when, and how hedging forex can add value in practice.</p> <h3>Why is a hedge in Forex important for traders?</h3> <p>For active forex traders, a hedge in forex is important because it is a practical layer of defence that complements stops and position sizing. These are the key benefits for traders:</p> <ul> <li><strong>Trade risk mitigation:</strong> Offsetting long or short traders when you <a href="/en/trading-academy/forex/order-types/">buy or sell</a> a currency pair helps reduce potential losses from unfavourable <a href="/en/trading-academy/forex/what-affects-forex-exchange-rates/">FX market moves</a> against your trades.</li> <li><strong>Volatility risk protection: </strong>Hedges reduce the impact of <a href="/en/trading-academy/forex/fundamental-analysis-definition-drivers-and-trading-methodology/">macro events</a> like the release of CPI, NFP and central bank surprises when <a href="/en/trading-academy/forex/forex-spreads/">spreads</a> and price gaps widen.</li> <li><strong>Capital preservation:</strong> By limiting the potential for trades going south, traders can hold longer-term positions and eventually secure profits or reinvest.</li> <li><strong>Better decision-making:</strong> Having a solution to a potential loss makes it easier to stick to a <a href="https://www.thinkmarkets.com/TMXWebsite/media/TMXWebsite/10-tips-to-successful-trading-pdf.pdf" target="_blank">plan</a> and avoid emotional outbursts.</li> <li><strong>Flexibility:</strong> Use partial or direct hedges or correlation hedges to keep drawdowns and margin strain in check while still keeping some upside.</li> </ul> <p><img alt="Benefits of fedging forex risk in FX market (ThinkMarkets)" src="/getmedia/5132bc8a-58ad-40a1-be01-89c24fd5c725/Academy-Forex-trading-hedging-strategies-may-benefit-traders.png" /></p> <p style="text-align: center;">Forex trading hedging strategies may benefit traders</p> <p>If hedging forex fits your goals, you will need to understand how forex hedging <a href="/en/trading-academy/forex/popular-forex-trading-strategies/">strategies</a> actually work, the mechanics behind it and the hedging tools you can use.</p> <h2>How Forex hedging strategies work</h2> <p>Forex hedging strategies work by establishing counterpositions to balance your existing traders, with the goal of reducing the impact of adverse market movements on your bottom line. The closer the hedge mirrors your original exposure, the more stable your P&L becomes.</p> <p>Most retail FX hedge strategies fall into different hedging techniques. The three most popular hedging strategies in forex are:</p> <ol> <li><strong>Direct hedge</strong></li> <li><strong>Cross hedge</strong></li> <li><strong>Correlation hedge</strong></li> </ol> <p><img alt="Types of hedging forex strategies (ThinkMarkets)" src="/getmedia/4096f976-437b-45bf-8745-828696e38c45/Academy-Forex-How-will-hedging-works-depends-on-the-employed-forex-trading-strategy.png" /></p> <p style="text-align: center;">How well hedging works depends on the employed forex trading strategy</p> <h3>1. Direct hedge</h3> <p>A direct hedge means opening an equal and opposite position on the same currency pair. If you take a long position of 1 lot EURUSD and you then take a short position of 1 lot EURUSD, your net exposure is near zero: losses on one side are offset by gains on the other, minus hedging costs.</p> <p>Traders use direct forex hedges when they want immediate, high‑fidelity protection during a short window, for example, before a central bank decision, across a weekend, or while spreads are likely to widen. The trade-off is straightforward: you pay two spreads (and swaps if held overnight) and cap any drawdowns while the hedge is on. Many traders prefer partial direct hedges, like shorting 0.5 lot against a 1‑lot long, to reduce volatility but keep some participation if the move goes their way.</p> <p><strong>Quick steps:</strong></p> <ul> <li>Identify exposure (e.g., long 1.0 lot EURUSD).</li> <li>Decide protection level (full vs partial).</li> <li>Execute the opposing position (short 1.0 lot for full; short 0.5 lot -> 50% hedge).</li> <li>Remove the hedge once the catalyst passes or your thesis changes.</li> </ul> <p>The effectiveness of direct hedges is higher over short windows; costs compound if held for long.</p> <h3>2. Cross hedge</h3> <p>With a cross hedge, you neutralise the exposure to one currency in the pair using a different pair that shares that currency. Suppose you are long EURUSD. You are long euros and short US dollars, effectively hedging against the dollar. To neutralise the USD leg, you might buy USDJPY.</p> <p>Let’s take an example: long 1 lot EURUSD at 1.1000 means long €100,000 and short $110,000.</p> <p>Buying roughly $110,000 notional USDJPY (about 1.10 lots) offsets most of the USD moves, leaving you effectively long EURJPY between the two trading pairs. This introduces basis risk because the hedge won’t track EURUSD perfectly. However, it can be a useful way to remove exposure to a dominant currency while keeping your view on a cross.</p> <p>Some examples of cross-hedge combinations in forex are:</p> <ul> <li>EURUSD forex hedge with EURGBP></li> <li>USDCAD forex hedge with USDCHF</li> <li>GBPUSD forex hedge with GBPJPY</li> </ul> <h3>3. Correlated pair hedge</h3> <p>Here, you offset risk using two currency pairs that tend to move together. For example, a long EURUSD might be partially hedged by short GBPUSD if the two have shown solid positive correlation recently.</p> <p>Correlation values range from –1 (perfect negative correlation) to +1 (perfect positive correlation). For example, if correlation is around +0.80 and the volatilities of the two pairs are similar, a 1.0 lot original exposure should be paired with 0.8 lots in the hedge. Sizing is based on relationship strength and volatility, not just equal lots.</p> <p><img alt="Strategies for hedging in trading (ThinkMarkets)" src="/getmedia/5232393b-4435-45e9-a42a-bbe89724b625/Academy-Forex-FX-Hedging-Strategies-Comparison.png" /></p> <p style="text-align: center;">FX Hedging Strategies Comparison</p> <p>Knowing forex hedge strategies is one thing; hedging through a specific set of trading instruments is another.</p> <p><strong>Want to hedge, but are only a beginner? Open a demo and put your hedge strategy to the test.</strong></p> <h2>What instruments are used for FX hedge management</h2> <p>There are many instruments one can use to manage FX hedges based on what best matches your timeframe and precision needs, as well as your cost budget. Here are the four most common forex options:</p> <ul> <li><strong>CFDs:</strong> Fast, granular execution for direct, cross and correlation hedges. Costs are spreads, commissions, and overnight swaps.</li> <li><strong>Futures:</strong> Exchange‑traded and standardised. Suitable for larger or scheduled hedges but less granular; consider contract size, expiry and roll costs.</li> <li><strong>Forwards:</strong> Lock in a future rate for cash flows. Flexible for receivables and payables, but not as good for short-term active trading.</li> <li><strong>Options:</strong> Pay a premium to limit the risk of loss while keeping gains. Liquidity and premium costs are very important.</li> </ul> <p>Let’s put the framework to work with a realistic example of hedging in forex using CFDs.</p> <h2>Forex hedging example: Risk management of a position gone wrong</h2> <p>Before delving into the hedge example (CFD hedge), remember that an effective hedge in forex combines a clear objective and a sizing method that reflects volatility and correlation, i.e. effective risk management.</p> <p>Let’s get into the math side of forex hedges to ensure you have all you need to get started.</p> <h3>Forex market hedge ratio calculation</h3> <p>The goal is to turn a desired protection level into a simple, executable hedge size. A practical way to do that is with a hedge ratio that reflects how closely your hedge offsets the exposure you want to reduce.</p> <h4><strong>Hedge ratio formula</strong></h4> <p><img alt="Hedge calculator (ThinkMarkets)" src="/getmedia/233bea45-bac8-4e78-a89f-ef1c72137534/Academy-Forex-Hedge-effectiveness-formula.png" /></p> <p style="text-align: center;">Hedge effectiveness formula</p> <p><strong>What this means in practice:</strong></p> <ul> <li>If you are hedging with the exact same pair (direct hedge), correlation is effectively 1.0, so the hedge size is simply the percentage you want to protect.</li> <li>If you use a related instrument (as in a cross or correlated hedge), correlation will be less than 1.0, and volatilities may differ, so you scale the size accordingly. The lower the correlation, the less protection each unit of hedge delivers.</li> <li><strong>Setup:</strong> Long 1.00 lot EURUSD; target 50% protection using GBPUSD.</li> <li><strong>Inputs:</strong> Correlation = +0.85; volatility ratio = 0.90; Notional ratio = 0.87 ($110k lot value EURUSD ÷ $127k lot value GBPUSD).</li> <li><strong>Size:</strong> Hedge = 1.00 × 0.50 × 0.77 × 0.87 = 0.33 lots short GBPUSD.</li> </ul> <h3>Forex hedging example</h3> <p>Imagine you are long 1.00 lot of EURUSD at 1.1000, expecting euro strength due to a hawkish ECB policy change. But ahead of US CPI, it dipped to 1.0990, leaving you $100 down (10 pips).</p> <p>Your thesis still holds. The euro could rebound if inflation comes in soft, but you want to protect around 50% of your exposure without fully capping the upside. You plan to exit the hedge post-release or if the price moves above 1.1010.</p> <p>You pick GBPUSD and short 0.33 lots at 1.2950, using the aforementioned hedge formula.</p> <p><strong>Downside scenario:</strong> EURUSD to 1.0940, -50 pips; GBPUSD to 1.2900, -50 pips</p> <ul> <li>EURUSD loses $500</li> <li>GBPUSD hedge gains = $165</li> <li><strong>Net</strong> = -$335</li> </ul> <p><strong>Upside scenario:</strong> EURUSD to 1.1040, +50 pips; GBPUSD to 1.3000, +50 pips</p> <ul> <li>EURUSD gains $500</li> <li>GBPUSD hedge loses = $165</li> <li><strong>Net</strong> = +$335.</li> </ul> <p>Costs:</p> <ul> <li>Two spreads plus potential swaps</li> <li>Imperfect correlation adds basis risk from GBP-specific moves</li> </ul> <p>With the hedging calculations cleared, let’s see how to set up a hedge trade in forex.</p> <h2>How to hedge Forex trades</h2> <p>To hedge a forex trade effectively, you need a structured framework that defines your exposure, objectives, method, sizing, execution, and ongoing management of the hedge.</p> <p>The process can be broken down into a series of clear steps:</p> <p><img alt="Trading hedging account with hedge broker (ThinkMarkets)" src="/getmedia/8a94db10-52d4-48fb-b064-1c1df69a80b0/Academy-Forex-FX-hedging-in-a-systematic-way.png" /></p> <p style="text-align: center;">FX hedging in a systematic way</p> <h3>Step 1. Identify downside risk exposure</h3> <ul> <li>Make a list of what you are effectively long and short by currency leg across all open positions.</li> <li>Note entries, size, pip value, and the time window you need to cover (minutes around a release, days across a central‑bank week).</li> <li>Flag concentration risk (e.g., a USD‑heavy book).</li> </ul> <h3>Step 2. Set currency hedging objectives</h3> <ul> <li>Decide the protection level (full neutrality for a short window, or partial to keep upside),</li> <li>Define the duration (event‑driven vs ongoing), and set removal triggers in advance (time, price, event outcome).</li> <li>Simple cost budget for spreads, swaps/forward points, and any option premium.</li> <li><strong>Exit triggers:</strong> Time‑based (after the event) and condition‑based (price, volatility, correlation).</li> </ul> <h3>Step 3. Select a CFD hedging method</h3> <ul> <li>Direct hedges are best for short, high‑uncertainty windows.</li> <li>Cross hedges neutralise a dominant currency leg while keeping a cross view.</li> <li>Correlation hedges offer flexibility but demand monitoring.</li> </ul> <h3>Step 4. Calculate size using online tools</h3> <ul> <li>Same‑pair hedges are straightforward (lot‑for‑lot for full protection; scale for partial).</li> <li>Cross (match the shared leg): Convert to the shared currency notional. Example: Long 1 lot EURUSD at 1.1000 → short USD ≈ $110,000. Buy ≈ 1.10 lots of USDJPY to hedge USD.</li> <li>For related instruments, use a correlation- and volatility-aware ratio and match notional amounts on the shared leg when cross-hedging. Keep sizing rules simple and consistent.</li> </ul> <h3>Step 5. Execute on the forex broker platform</h3> <ul> <li>Place the hedge and set alerts.</li> <li>Around major news, spreads can widen, consider limits or smaller clips.</li> <li>Label or group forex positions so net exposure is easy to track.</li> </ul> <h3>Step 6. Monitor and manage</h3> <ul> <li>After catalysts or large moves, reassess correlation/volatility and resize or remove the hedge per your triggers.</li> <li><strong>Track costs and ask:</strong> did drawdowns and variance fall as planned after costs? Refine if not.</li> <li>Remove or reduce the hedge when triggers fire or your thesis is confirmed/invalidated.</li> </ul> <p>Let’s now examine common hedging mistakes and how to avoid them for smarter hedging.</p> <p><strong>Trade up to 4,000 instruments with zero commission across seven global markets on ThinkTrader!</strong></p> <h2>Hedging mistakes & tips when trading forex</h2> <p>Even solid trading plans can fail when mistakes creep in. Here are the most common ones and practical solutions for them.</p> <ul> <li><strong>Over-hedging</strong> happens when you protect too much, too often. It turns potential winners flat, doubling costs like spreads and swaps while killing upside. Studies show excessive hedging in forex can reduce portfolio returns by up to 25% in volatile markets.</li> <li><strong>Underestimating costs</strong> is a silent killer. Beyond obvious spreads, swaps and premiums add up, especially in choppy conditions where slippage widens. Many beginners overlook this, turning a smart hedge into a net loss.</li> <li><strong>Failing to monitor and adjust</strong> (set and forget) combines poor timing with static thinking. Correlations shift after news, volatility spikes, and hedge ratios drift as prices move—what worked at open may fail halfway during a trade. Without active checks, you are exposed when conditions evolve.</li> <li>Hedging weakly correlated pairs gives <strong>false comfort</strong>. If pairs don't move together reliably (below 0.7 correlation), protection crumbles during stress. Always verify with recent data. Mismatched hedges can lead to up to 30% higher losses in correlation breakdowns.</li> </ul> <p><strong>Practical tips</strong></p> <ul> <li><strong>Hedge selectively:</strong> Limit hedging to high-risk windows like major data releases, using a partial coverage of 30% to 70% to preserve potential gains.</li> <li><strong>Factor all costs upfront:</strong> Calculate spreads, swaps, and opportunity costs. If they exceed the expected protection, abort.</li> <li><strong>Stay active:</strong> Review correlations daily after catalysts or weekly; adjust sizes for price movements like you would do in a live position.</li> <li><strong>Verify pairs:</strong> Use rolling 30 or 60-day correlations above 0.7, but test on demo first to avoid any surprises.</li> </ul> <p><img alt="Risk exposure (ThinkMarkets)" src="/getmedia/96811f72-6f36-41a9-9c68-afd2f97171ad/Academy-Forex-Hedge-Common-hedging-mistakes-and-practical-fixes.png" /></p> <p style="text-align: center;">Common hedging mistakes and practical fixes</p> <p>Now that we've covered the dos and don'ts, let's see if hedging forex aligns with your <a href="/en/trading-academy/technical-analysis/method-to-analyse/">trading style</a>.</p> <h2>Is hedging right for you?</h2> <p>Forex hedging is for traders and investors who want to lock in an exchange rate to protect their portfolio from adverse price moves. However, as with any other form of trading in the financial markets, there is a high risk of losing money when hedging forex.</p> <p>Still, for swing or position traders, hedging in forex makes it possible to ride longer-term trends through short-term bursts of volatility. But hedging forex is not universally suitable for all trading styles and requires regular monitoring, since correlations can shift quickly and costs can add up. For scalpers, for example, the extra costs of hedging forex trades usually outweigh the benefits. If you are thinking of opening a forex hedging account to countertrade your risk, there is a lot to consider.</p> <p>Ready to hedge forex pairs with reduced costs? Try ThinkZero here!</p>
Short selling: What is it, types & strategies
<p>Short selling allows traders to generate returns when an asset’s stock price or market value falls. Unlike most investors who buy shares in hopes the price of the stock will rise, shorting stocks is the opposite: short sellers short the stock first with an aim to buy it back at a lower price to capture the difference.</p> <p>Selling short makes markets function better. Over the years, this practice of going short on a stock has become an important part of modern portfolio management for both institutional and retail investors. A 2002 study in the Journal of Finance found that heavily shorted stocks on the Nasdaq experienced losses of −0.76% to −1.13% per month after the short interest ratio rose. To put it simply, when short sellers engaged in shorts, they made the right choice.</p> <p>At ThinkMarkets, we give traders a full suite of tools to go short not only on stocks, but also on forex, gold and oil, and other assets, primarily through Contracts for Difference (CFDs). The ThinkTrader app offers advanced risk management tools, competitive spreads, and access from multiple devices, making it straightforward to take advantage of opportunities in any market direction.</p> <p>What you'll learn in this guide:</p> <ul> <li>How to sell short in the market and the basic rules for doing so.</li> <li>The main differences between traditional short selling and CFD short selling are.</li> <li>Examples and short selling strategies from experienced traders.</li> <li>Important techniques to manage risk when you are in a short position.</li> <li>A step-by-step guide to short trading using CFDs.</li> </ul> <p>Let's begin by understanding what is a short trade and how it works.</p> <p><strong>Know all about short selling CFDs? Open your ThinkMarkets account <a href="https://portal.thinkmarkets.com/account/individual/?lang=en" target="_blank">here</a>!</strong></p> <h2>What is short selling?</h2> <p>Short selling is a trading strategy that lets traders sell a stock or another asset without actually owning it. In the past, this was done when a short seller borrowed shares of stock from a broker that allowed short selling or another investor and then sold them on the open market. If the <a href="/en/trading-academy/stocks/what-affects-stock-prices/">stock price</a> fell as anticipated, the trader could buy the stock at the lower price, cover their short positions, return them to the lender, and pocket the difference. If the stock price rises instead, the short seller must repurchase the stock at a stock price higher than they sold it for and take a loss.</p> <p><img alt="Shorting Stocks Explained (ThinkMarkets)" src="/getmedia/7fa97bb5-ae96-4f5f-9a68-d64cf023362e/Academy-Forex-Short-selling-How-does-it-Work.png" /></p> <p style="text-align: center;">How short selling works</p> <p><a href="/en/trading-academy/cfds/what-are-cfds/">CFDs</a>, on the other hand, are a type of derivative that strips out the borrowing and ownership complexities, making short selling a stock simpler and without the need to physically hold shares. But the profit-and-loss math remains the same.</p> <p>Let's see what short selling the stock market might look like in real life:</p> <h3>Short selling example</h3> <p>Imagine going short on a stock. The calculation for short selling is:</p> <p><img alt="Short Selling Meaning (ThinkMarkets)" src="/getmedia/223c8a43-de83-4161-9ca1-50bfcb081bd6/Academy-Forex-Short-selling-Profit-Loss-Formula-Calculation.png" /></p> <p style="text-align: center;">Short sell formula</p> <p>This formula can be used to short <a href="/en/tsla/">Tesla stock</a> or even take a S&P 500 short.</p> <p>Now, assume you want to engage in short selling 20 shares of <a href="/en/amzn/">Amazon (AMZN)</a> at $200 each and later cover the short by buying them back at $170 each. Your gross profit would be ($200 − $170) × 20 = $600 (before costs).</p> <p><img alt="What is Short Trading Amazon Stock (ThinkMarkets)" src="/getmedia/95ac97ec-cb7a-4f22-8ff4-b02c48a4d874/Academy-Forex-Short-selling-AMZN-Chart.png" /></p> <p style="text-align: center;">AMZN chart shorting example</p> <h2>Why is short selling important</h2> <p>Investors and traders alike often view short selling as important for generating returns in bear markets, but it also plays a vital role in market efficiency and transparency. In practice, short positions help bring the price of a stock back down and let investors manage risk when valuations get too high or <a href="/en/trading-academy/forex/currency-volatility/">volatility spikes</a>. <a href="/en/trading-academy/technical-analysis/method-to-analyse/">Short trades</a> also add more liquidity to the markets and give hedge funds, mutual funds, and retail traders a way to react when a stock may be overpriced.</p> <p><img alt="Advantages of Short Selling (ThinkMarkets)" src="/getmedia/0eb4591e-8d97-4003-8560-7a0f0b063aec/Academy-Forex-Short-selling-Benefits-for-Markets.png" /></p> <p style="text-align: center;">Selling short benefits market</p> <p>Here is more context about the four reasons why short positions in stock markets are a necessary part of a healthy financial market:</p> <ul> <li><strong>Price discovery:</strong> Short selling helps uncover assets that are overpriced, which leads to more accurate valuations and stops speculative bubbles from forming. Short interest and other data on short positions help traders spot these opportunities.</li> <li><a href="/en/trading-infrastructure/"><strong>Market liquidity:</strong></a> When investors and traders sell a stock short, it makes it easier for others to get in and out of positions by increasing trading volume, which allows for tighter <a href="/en/trading-academy/forex/forex-spreads/">spreads</a>.</li> <li><strong>Risk management:</strong> The sale of a stock helps investors protect their portfolios, avoid losses from long holdings and lower their risk during downturns.</li> <li><strong>Profit opportunities in bear markets:</strong> Shorting particular stocks enables profit-making when traditional assets go down.</li> </ul> <p>Now that we know what is a short and how shorting the market works, let's look at the way selling stocks can be done.</p> <h2>Main types of short selling</h2> <p>There are different ways to short the market, each with its own rules, costs, and associated risks. The three main types of short selling are:</p> <ol> <li><strong>Traditional short selling</strong></li> <li><strong>CFD-based shorting</strong></li> <li><strong>Alternative derivative methods</strong></li> </ol> <p><img alt="Types of Shortable Stocks (ThinkMarkets)v" src="/getmedia/9d08754a-4e22-4cc0-9fc6-d0e1808fda43/Academy-Forex-Short-selling-Short-Selling-Types.png" /></p> <p style="text-align: center;">Different ways of selling short</p> <p>Let’s break them down one by one.</p> <h3>1. Traditional short selling</h3> <p><strong>Covered short selling</strong> is the standard borrowing process for institutions and experienced traders going short in the stock market. But it has ongoing costs and complicated arrangements that make it hard for many retail traders to take a short position.</p> <p><strong>Naked short selling</strong> involves shorting stocks without first making borrowing arrangements. This practice is illegal in most places due to settlement risks and market manipulation concerns.</p> <h3>2. CFD-based shorting</h3> <p>Opening a <a href="/en/trading-academy/cfds/how-does-cfd-trading-work/">CFD short position</a> bypasses traditional complexities by executing the trade directly via a broker. Traders can use short selling to get exposure across many asset classes, short a currency, engage in <a href="/en/trading-academy/commodities/gold-trading-strategy-for-2025/">gold</a> shorting or short Dow Jones, all without worrying about borrowing and dividend adjustments.</p> <h3>3. Alternative derivative methods</h3> <p><strong>Futures contracts</strong> allow traders to <a href="/en/stocks-trading/">go short on a stock</a> and enable short selling in <a href="/en/trading-academy/forex/what-is-forex-trading/">forex</a> or <a href="/en/commodities-trading/">commodities</a> for future delivery. This gives them short exposure through standardised contracts traded on exchanges with fixed settlement dates.</p> <p><strong>An inverse <a href="/en/etf-trading/">ETF</a></strong> is a purpose-built product that delivers the opposite performance of underlying assets through daily rebalancing. These are popular for short trading strategies in equities and indices, but they work best when invesotrs close the short position fast due to compounding effects over time.</p> <p><strong>Start trading CFDs on shares, forex, commodities, and more from one platform - <a href="https://portal.thinkmarkets.com/account/individual/" target="_blank">ThinkMarkets</a></strong></p> <h2>How does short selling work (Traditional vs. Modern)?</h2> <p>The practice of short selling might look simple. But how it really works has a big impact on your risk, costs, and flexibility as a trader. Let's look at how the two main short-selling methods work in the real world.</p> <h3>1. Traditional (Covered) short selling</h3> <p>The traditional shorting method is a complicated process with many steps that involves borrowing of the physical asset, where a short seller borrows shares through a brokerage. There are a lot of rules and obligations that come with this process because stock market short selling is regulated in most countries. Here's a quick summary:</p> <ol> <li><strong>Locate & borrow:</strong> Your broker finds shares you can borrow, often through a network of lenders.</li> <li><strong>Sell the shares:</strong> You order to short the borrowed shares at the current market price.</li> <li><strong>Monitor the position:</strong> While the position is open, you pay ongoing borrowing fees, interest on stock on margin, and you remain responsible for any dividends since the short seller is responsible for these payments.</li> <li><strong>Buy back (Cover):</strong> When you want to exit the position, you buy back the stock, the exact number of shares, at a lower price.</li> <li><strong>Return shares:</strong> The shares go back to the lender, and your net result on the trade is the difference in prices, minus any costs.</li> </ol> <p>There are a lot of risks involved with short-selling the stock market in this process, especially if the price of the value of the stock rises unexpectedly. You will usually have to pay a borrowing fee that can be as low as 0.3% or as high as 20% a year. You will also need to <a href="/en/trading-academy/forex/margin/">maintain a margin</a>, which is usually 150% of the value of your position. Also, if the company pays a dividend while you are short, you have to pay the divident.</p> <h3>2. CFD short selling</h3> <p>CFD short selling removes the obligation to borrow the actual shares, allowing you to open a short position instantly and close it as quickly. When you trade a CFD, you are not actually selling a stock or buying the underlying asset, i.e., you are not involved with short selling. Instead, you are speculating on the future price of the stock or other market instrument. There is no borrowing or returning of shares involved. Rather, you are going into a contract with our broker that tracks its price changes. You make a profit if the price goes down, or take a loss if the price of the stock rises. With CFDs, you can <a href="/en/futures-trading/">short Nasdaq or ASX</a>, open a short position in forex, or short gold.</p> <p><img alt="CFD Shorting Process (ThinkMarkets)" src="/getmedia/42bcb0a2-0762-49a4-b6fb-bba3e661c746/Academy-Forex-Short-selling-CFD-Shorting-Process.png" /></p> <p style="text-align: center;">Process of CFD short position</p> <p>This is how it works in trading:</p> <ol> <li><strong>Open a short CFD position:</strong> You enter a sell position with a click.</li> <li><strong>Manage the trade:</strong> Set levels for taking profits and stopping losses, and change them as needed.</li> <li><strong>Close the position:</strong> To get out of the position, close the trade when you are ready.</li> </ol> <p>Below, you can see how the two types of shorting differ.</p> <h3>Traditional shorting vs. shorting CFDs</h3> <p><img alt="Traditional and CFD Short in Stock Market (ThinkMarkets)" src="/getmedia/a514f06b-4bea-4552-a1cb-2026f3f89173/Academy-Forex-Short-selling-Traditional-Shorting-vs-CFDs.png" /></p> <p style="text-align: center;">Comparison of traditional short selling and short selling CFD</p> <p>CFDs remove many of the barriers that come with traditional shorting, making them the go-to way for short trading among retail traders. Let’s look at why.</p> <h2>Why short sellers prefer CFD shorting</h2> <p>Lower costs, faster execution, access to multiple asset classes and the ability to short and long in trading are some of the key reasons short sellers prefer CFD shorting. Here’s a quick summary:</p> <ul> <li><strong><a href="/en/trading-infrastructure/">Quick execution</a>:</strong> No waiting for shares to be found.</li> <li><strong>Broad asset selection:</strong> Short a lot of different markets and assets, not just stocks.</li> <li><strong>Transparent costs:</strong> You know your spread and most trading costs ahead of time.</li> <li><strong>Flexible leverage:</strong> Lets you amplify your position size but also multiplies risks.</li> <li><strong>Longer trading hours:</strong> Many CFD brokers trade outside of regular exchange hours.</li> <li><strong><a href="/en/trading-academy/forex/risk-management/">Manage risks</a>:</strong> Traders can buy long, sell short, not just go short, which allows them to hedge.</li> </ul> <p>Although CFD positions have benefits, they come with risks that can amplify both losses and gains. It is important to manage your risks.</p> <h2>Risks & advantages of short selling</h2> <p>Short selling carries significant risks. But when used wisely, it can be a powerful source of advantage for traders. Let’s take a look at the biggest challenges and rewards.</p> <h3>Biggest challenges when selling short</h3> <p>The biggest risk of shorting the market is that losses could be unlimited if the price of the asset keeps rising, especially for large short positions. Meanwhile, your potential profit is limited because the price can only go down to zero.</p> <p>Here is a closer look at the main risks that come with shorting the market:</p> <ul> <li><strong>Unlimited loss potential:</strong> When you short a stock, you can lose more than just your original investment, as prices can keep going up.</li> <li><strong>Short squeeze risk:</strong> When prices increase significantly, short sellers may have to buy back at much higher prices, which makes their losses even worse.</li> <li><strong>Timing difficulties:</strong> Markets usually go up over time, and to short successfully, you need to be very precise with your timing.</li> <li><strong>Costs and margin:</strong> Borrowing fees, interest costs, and margin requirements can cut into profits and raise risks.</li> <li><strong>Regulatory restrictions:</strong> During market stress, the authorities may stop or limit short investments, or they may enforce rules like the uptick rule.</li> </ul> <p>Of all these, the short squeeze is the one that can turn a small mistake into a big loss. Let’s now look at it in more detail.</p> <h4>Short squeeze explained</h4> <p>A <a href="/en/trading-academy/stocks/what-affects-stock-prices/">short squeeze</a> is a market phenomenon where the price of a heavily shorted asset suddenly goes up and short sellers have to buy back shares to cut their losses. This buying spree can start a cycle that keeps pushing the price up even more. Once it starts, it can pick up speed quickly and catch many traders off guard. Some prominent short squeezes in investing books are the infamous GME and AMC short squeezes. Let's look at the GME squeeze.</p> <h4>GameStop short squeeze in 2021</h4> <p>In early 2021, a group of retail traders coordinated on Reddit to buy up the GameStop stock, which went from about $13 to $320 in just a few weeks. This forced institutional sellers to cover at huge losses. With more shares sold short than were actually available (GME short interest spiked over 140%), their routine short play turned into one of history's most infamous squeezes. GME crashed back to $35 in just two weeks.</p> <p><img alt="Short Squeeze Stocks (ThinkMarkets)" src="/getmedia/a07a6cbf-42a9-4f5d-9c09-5da34574d3cc/Academy-Forex-Short-selling-GME-Short-Squeeze-Trade.png" /></p> <p style="text-align: center;">GME short squeeze trade</p> <p>However, prices didn’t just go up and down once. Volatility continued over a period of a few months before GME stock finally settled near $20, with several other short squeezes taking place. It is important to know what short selling metrics signal a short squeeze to avoid them.</p> <h4>Signs a short squeeze might be brewing</h4> <p>Short squeezes don't always give clear warnings, but there are a few red flags worth watching. If you spot these early, you might avoid getting caught in one or even benefit from a short squeeze:</p> <ul> <li><strong>High short interest:</strong> If it hovers above 20% of the float, it usually means too many bears are trading, which could lead to a reversal.</li> <li><strong>Days-to-cover ratio over 10:</strong> This is the time it would take short traders to exit the market on normal volume. A high number indicates vulnerability.</li> <li><strong>Sudden positive catalysts:</strong> Positive earnings or unexpected good news can trigger a buying frenzy.</li> <li><strong>Unusual trading signals:</strong> Volume spikes, heavy options activity, or price jumps that don't match the fundamentals.</li> </ul> <p>Short squeezes show us how quickly sentiment can change, which is why you should always factor in these risks. Traders who are good at <a href="/en/trading-academy/stocks/how-to-trade-stocks/">shorts in stock</a> markets are <a href="/en/trading-academy/technical-analysis/the-traders-guide-on-how-to-improve-trading-psychology/">disciplined</a>. They use small position sizes, keep an eye on costs, and set stop-losses to protect themselves from events that are hard to predict.</p> <p>Now that we have talked about the risks, let's look at what can go right with short selling.</p> <h3>The advantages of short selling</h3> <p>Despite the risks, there are reasons why short selling is part of traders' strategies.</p> <p>Selling short, be it going short in forex, indices, commodities or stocks, lets you:</p> <ul> <li><strong>Gain in declining markets:</strong> Benefit even when most assets are losing value.</li> <li><strong>Hedge your portfolio:</strong> Make up for losses in long positions when the market goes down.</li> <li><strong>Diversify your investments:</strong> Don't just trade in markets that are going up.</li> </ul> <p>Here’s a brief summary of how the risks and rewards stack up when going short and long in trading:</p> <p><img alt="Long Short Buy Sell (ThinkMarkets)" src="/getmedia/f2516e5f-a169-4d63-84d3-23b530dff3b5/Academy-Forex-Short-selling-Long-vs-Short-Comparison.png" /></p> <p style="text-align: center;">Risks and benefits of going long vs going short</p> <h2>Short selling strategies</h2> <p>Understanding the risks and rewards is only one part of the puzzle. The other part is having a good short trading strategy. Traders who have been in the trading business for a while use certain short trading strategies to protect themselves from losses, spot trend reversals, or ride bearish trends.</p> <p>Here are a few common trading strategies for short selling:</p> <ul> <li><strong>Hedging:</strong> Use shorts to protect your long positions. Instead of trying to profit, think of it as a defence.</li> <li><strong>Peak reversal:</strong> Target assets that are overbought at the peak. A trend reversal to the downside can happen when momentum weakens and bearish patterns form.</li> <li><strong>Trend following:</strong> Join established downtrends, which is like <a href="/en/trading-academy/indicators-and-patterns/adx-indicator-how-it-works-trend-strength-signals-and-trading-strategies/">riding uptrends</a> but in the opposite direction. Traders usually short when prices break through key support levels and then let the momentum play out.</li> </ul> <p>Let's take a forex short selling example on the EURUSD. Notice how every time the EURUSD reached an overbought RSI level, a <a href="/en/trading-academy/indicators-and-patterns/double-top-reversal-pattern/">peak reversal</a>, it simply turned.</p> <p><img alt="EURUSD Short Forex (ThinkMarkets)" src="/getmedia/c44bda9d-c54c-4baa-ac0a-92d1f146b7bc/Academy-Forex-Short-selling-EURUSD-Peak-Reversal-RSI-Overbought.pngv" /></p> <p style="text-align: center;">EURUSD Peak Reversal, RSI Overbought</p> <p>One of the benefits of CFD trading is that it allows you to trade both sides of the market. Let's look at how to short CFDs on ThinkMarkets.</p> <p><strong>Ready to put your short trading strategy into action? <a href="https://portal.thinkmarkets.com/account/individual/" target="_blank">Open</a> a CFD trading account now!</strong></p> <h2>How to short CFDs at ThinkMarkets</h2> <p>ThinkMarkets makes it straightforward to short CFDs on stocks, forex, indices, commodities, and crypto by executing trades quickly. ThinkTrader (for the web, desktop, or mobile) is one of the best platforms for shorting stocks, with advanced tools like 80+ <a href="/en/trading-academy/technical-analysis/trend-trading-indicators-for-forex/">indicators</a>, real-time data, and mobile alerts to help you stay in charge.</p> <p>Here's a simple guide that will help you get started.</p> <p><img alt="CFD Shorting on Margin (ThinkMarkets)" src="/getmedia/c2ac21bd-38c9-448d-a3fe-94fa1a911a34/Academy-Forex-Short-selling-step-by-step-process.png" /></p> <p style="text-align: center;">Step-by-Step process for short selling CFDs</p> <h3>Step 1. Set up your long and short CFD account</h3> <p>Getting started is easy and fast.</p> <ul> <li>Go to the ThinkMarkets website, one of the short selling brokers allowing shorts via CFDs, and sign up with your information.</li> <li>Upload your ID to finish the quick KYC check.</li> <li>Fund your account by bank transfer, card, or e-wallet.</li> <li>Access ThinkTrader on web, desktop, or mobile, a streamlined app to short stocks and indices alongside other markets.</li> </ul> <h3>Step 2. Research the market</h3> <p>Spot your bearish opportunity before diving in.</p> <ul> <li>Use ThinkTrader’s scanners to find stocks to short (e.g., weak momentum, support breaks) and set up short trading strategies/short selling strategies.</li> <li>Combine technicals (<a href="/en/trading-academy/technical-analysis/day-trading-chart-patterns/">charts</a>/indicators) with fundamentals (<a href="/en/trading-academy/indicators-and-patterns/what-are-forex-economic-indicators-and-how-they-impact-forex/">news</a>/earnings) to validate the setup.</li> <li>Figure out the risks if you’re wrong, particularly on short positions where squeezes or gaps can occur.</li> </ul> <h3>Step 3. Prepare your CFD trade</h3> <p>Have a plan to protect your capital.</p> <ul> <li>Size the trade with the risk in short selling in mind (for example, 1–2% of account value), and account for the cost of short selling when planning risk-reward.</li> <li>Based on your analysis, set profit targets and <a href="/en/thinktrader/thinktrader-introduces-trailing-stop-loss-feature-for-advanced-risk-management/">stop-losses</a> appropriate for short trading strategies (breakdowns, reversals, or trend continuation).</li> </ul> <h3>Step 4. Short a stock or other asset</h3> <p>Time to make your move. It's instant with CFDs.</p> <ul> <li>Open the chart of your selected instrument on the <a href="https://web.thinktrader.com/account/login" target="_blank">ThinkTrader platform</a>.</li> <li>Place a market order (now) or a limit order (at a certain price) to execute a selling CFD order.</li> <li>Click “<a href="/en/trading-academy/forex/order-types/">Sell</a>” to open a CFD short position; you’re going short on a stock with a tap.</li> </ul> <p>Tip: On mobile, one-tap orders in the <a href="/en/thinktrader/">app</a> to short stocks make this seamless, even on the go.</p> <h3>Step 5. Monitor and manage the trade</h3> <p>Stay on top once you're in.</p> <ul> <li>Track your short positions and other CFD positions with real-time updates on the portfolio dashboard.</li> <li>Adjust your stops, set alerts for important levels, or take partial profits, especially if you’re using leverage shorting.</li> <li>Stay up to date on news, earnings, or catalysts that could affect your short trade and be ready to cover your short position if conditions change.</li> </ul> <p>That's it! CFD shorting on ThinkMarkets is straightforward and user-friendly, with good spreads and full mobile functionality, making it easy to open a CFD short position, manage short trades, and cover short positions when needed.</p> <p><strong><a href="https://portal.thinkmarkets.com/account/individual/" target="_blank">Open</a> a ThinkMarkets account today and start trading CFDs across multiple asset classes!</strong></p>
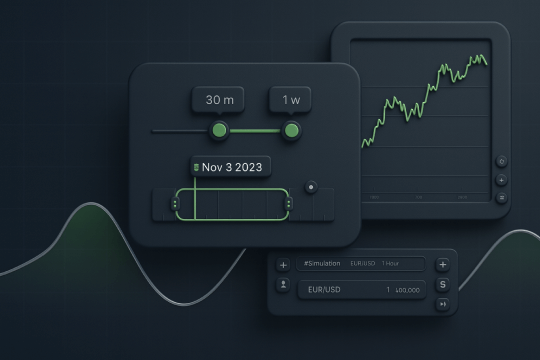
Forex Backtesting: Validate Currency Strategies Before Risking Capital
<p>Forex backtesting is considered by most traders either too time-consuming or convoluted. However, trading live currency markets without first evaluating strategies has proven to be a poor practice for forex traders. Research shows that only 2% can accurately predict currency price movements consistently.</p> <p>Gaining experience in live markets can be a beneficial experience for some beginner traders at times. However, trading an untested trading strategy can be more financially devastating than advantageous. Losses in trading make backtesting in forex an essential tool to validate strategies before risking your capital.</p> <p>Through strategy backtesting, traders can simulate hundreds of trade scenarios, identify weak trading signals, and refine forex strategies in a risk-free setting. At ThinkMarkets, we have created a free forex backtesting software that simplifies this process while replicating real market conditions: <a href="/en/traders-gym/">TradersGym</a>.</p> <p>When you backtest forex strategies with Traders Gym, you can save time and money as well as boost your trading confidence and create new trading systems.</p> <p><strong>In this article, we will go over:</strong></p> <ul> <li>How to evaluate trading strategies the right way using historical market data</li> <li>Essential performance metrics for measuring strategy performance</li> <li>Common pitfalls in standard forex backtesting methods and how to avoid them</li> <li>Forex simulation techniques to validate and refine your trading strategy</li> <li>Step-by-step process to effectively evaluate a strategy with free backtesting online</li> <li>Best practices for hitting your trading goals with reliable testing results</li> </ul> <p>Whether you are a beginner in forex trading or looking to improve your existing strategy by backtesting free, this article aims to help you join the ranks of traders who know how to achieve their trading objectives.</p> <div> <style type="text/css">.didyouknow { display: block; background: #F1FDf0; width: 600px; border-radius: 20px; gap: 20px; padding-top: 48px; padding-right: 40px; padding-bottom: 48px; padding-left: 40px; font-family: Figtree; font-weight: 600; font-size: 22px; line-height: 140%; letter-spacing: 0%; } </style> </div> <div class="didyouknow">Have a new strategy? <a href="https://play.google.com/store/apps/details?id=com.riflexo.tradeinterceptormobile" target="_blank">Test it</a> in a risk-free environment from anywhere!</div> <h2>What is Backtest in Forex?</h2> <p>A backtest in <a href="/nz/forex-trading/">forex</a> is a process used to evaluate trading strategies against historical currency pair prices to assess their potential in live markets. The objective of forex backtesting is to consider whether a strategy satisfies a trader's goals through systematic testing in a simulated environment.</p> <p>Traders often develop a <a href="/en/trading-academy/forex/popular-forex-trading-strategies/">forex strategy</a> using entry and exit rules, run it against historical data to gain insights into performance metrics and refine their approach. This process helps differentiate between theoretical ideas and tested trading strategies that either failed or passed specific performance criteria.</p> <p><img alt="Forex Backtest Performance Example" src="/getmedia/509eeea1-5110-4fcc-abed-e3238bc72630/Academy-forex-backtesting-zig-zag-trend-continuation-short-trade-with-macd-confirmation-gbpusd-1d-chart-3.png" /></p> <p style="text-align: center;">Forex Backtest Performance Example</p> <h2>Why Is Backtesting in Forex Trading Important?</h2> <p>Backtesting is important in forex trading for strategy development as well as strategy refinement in the ever-changing currency markets. This is particularly evident as a recent literature review of forex forecasting using machine learning showed that <a href="https://www.springeropen.com/epdf/10.1186/s40537-022-00676-2?sharing_token=40y1cotENtyjkK5ByjHfHm_BpE1tBhCbnbw3BuzI2RPid61TgyjEdOolGbysR9Nu9ptMRj2iWpPoBXjWBMZIhWmqcf0RLG1a6N496_Q6Lb5k8_04cJUA8zYcFCvVKE9CdlOD-UNc13Do8jIBQqDjQGtqKJDL_U-BgM_zxmKmxMU%3D" target="_blank">only 2% of retail traders can predict currency movements</a>, according to the Journal of Big Data.</p> <p>Backtesting forex strategies helps traders in five key areas:</p> <ol> <li><strong>Minimise Risk:</strong> Backtesting forex strategies against historical data helps protect trader capital by running them in a risk-free, simulated setting.</li> <li><strong>Improve Strategy Performance:</strong> Through backtesting, traders can fine-tune strategy rules, identify the optimal times and pairs to trade and achieve their goals.</li> <li><strong>Build Confidence:</strong> When a forex strategy performs across different market conditions and currency pairs, it builds trust into trading decisions.</li> <li><strong>Identify Weaknesses:</strong> Backtesting forex strategies assesses issues with a trading strategy before running it live, helping to address them early.</li> <li><strong>Quantifying Risk and Return:</strong> Metrics such as win rate, drawdown, profit factor and risk-reward ratio can indicate areas of strategy improvements.</li> <li><strong>Adapt to Markets:</strong> Regular forex backtesting helps ensure effectiveness as forex markets change, enabling consistency through validation and refinement.</li> </ol> <p>Understanding why backtesting trading strategies is important leads us to the metrics traders should focus on when evaluating their forex systems.</p> <div> <style type="text/css">.didyouknow { display: block; background: #F1FDf0; width: 600px; border-radius: 20px; gap: 20px; padding-top: 48px; padding-right: 40px; padding-bottom: 48px; padding-left: 40px; font-family: Figtree; font-weight: 600; font-size: 22px; line-height: 140%; letter-spacing: 0%; } </style> </div> <div class="didyouknow">To validate your trading strategy before going live, <a href="https://portal.thinkmarkets.com/account/individual/demo" target="_blank">open a demo account</a></div> <h2>What Are The Most Important Forex Backtesting Metrics</h2> <p>Some forex backtesting metrics prove to be more important than others when evaluating trading strategies. They help traders assess their effectiveness and potential for profitability.</p> <p><img alt="Forex Strategy Tester (ThinkMarkets)" src="/getmedia/a27a6db9-337d-4d4c-b8e1-a53701defcd1/Academy-Forex-Backtesting-Best-Forex-Indicators-for-Trend-Trading-ThinkMarkets.png" /></p> <p style="text-align: center;">Core Metrics to Backtest Forex Strategy</p> <p>*For better results, aim for 100 trades for a 12 to 24-month period (longer periods may introduce randomness), and test across different market conditions and timeframes.</p> <p>Beyond these core performance metrics, traders can also monitor:</p> <ul> <li><strong>Average Win/Loss:</strong> Number of winning and losing trades your forex strategy generates. Focus on reasonable impact on equity, i.e., ignore counting meaningless wins as wins.</li> <li><strong>Recovery Factor:</strong> How well the trading strategy recovers from drawdowns, which shows its resilience in different market conditions and lets you choose the best time to trade it.</li> <li><strong>Consecutive Losses:</strong> When a few losing streaks exceed 10% of your account, reconsider your approach.</li> </ul> <p>Understanding these metrics is a crucial step before backtesting forex strategies.</p> <div> <style type="text/css">.didyouknow { display: block; background: #F1FDf0; width: 600px; border-radius: 20px; gap: 20px; padding-top: 48px; padding-right: 40px; padding-bottom: 48px; padding-left: 40px; font-family: Figtree; font-weight: 600; font-size: 22px; line-height: 140%; letter-spacing: 0%; } </style> </div> <div style="text-align: center;"> <style type="text/css">.btn { font: Figtree; justify-content: center; align-items: center; text-align: center; gap: 7px; font-style: normal; font-size: 18px; line-height: 24px; padding: 13px 20px; border: 1px solid #ddd; border-radius: 38px; background: #5EE15A; } </style> </div> <div class="didyouknow">Tired of trading strategies that don’t work?<br /> <br /> <a class="btn" href="https://portal.thinkmarkets.com/account/individual/demo/" style="text-decoration: none; font-weight: 500; color: #000000; background: 5EE15A;" target="_blank">Develop a new one here for free!</a></div> <h2>Methods to Backtest Forex Trading Strategies</h2> <p>There are two methods to backtest forex trading strategies:</p> <ol> <li><strong>Manual Backtesting:</strong> Involves forex traders manually analysing historical charts and recording hypothetical trades based on strategy rules</li> <li><strong>Automated Backtesting:</strong> Uses backtesting forex software to apply trading rules to historical data, generating backtest reports quickly and efficiently</li> </ol> <p>Each forex backtesting method has distinct advantages depending on trading style (discretionary or systematic), technical expertise, time availability and strategy complexity.</p> <h3>1. Manual Backtesting by Forex Traders</h3> <p>Manual backtesting involves forex traders manually scrolling through historical data and charts to evaluate trades one by one. It requires:</p> <ul> <li>At least 100 trades for a reliable sample size</li> <li>Entry, take profit and stop loss points according to the forex strategy rules</li> <li>Account for spreads, commissions and slippage</li> <li>Detailed trade journals with screenshots of forex trades</li> </ul> <h3>2. Automated Backtesting Software for Forex</h3> <p>Automated backtesting uses a forex strategy tester that considerably reduces the need for manual backtesting. With an automated forex market simulator, traders can quickly and easily generate backtest performance reports. Options of forex simulators include:</p> <ul> <li>MetaTrader backtest using the MT4 strategy tester and the MT5 strategy tester</li> <li><a href="https://www.tradingview.com/broker/ThinkMarkets/" target="_blank">Backtest with TradingView</a> market replay function</li> <li>Other dedicated backtesting forex software with a trading strategy tester</li> <li>Custom coding solutions using Python or other languages</li> </ul> <p>Both manual and automated methods of forex backtesting are important for assessing trading strategies and improving them before live trading. On the one hand, market conditions and entry and exit rules must be defined and recorded manually to create a strategy. On the other hand, all backtests require some automation to test strategies quickly.</p> <p>While both methods are preferable to not backtesting a trading strategy at all, existing forex backtesting simulators like the MT4 backtest and MT5 backtest platforms come with limitations that can affect the accuracy of the tests.</p> <h2>Do Existing Methods to Backtest Forex Strategy Reflect Trader Needs?</h2> <p>The existing backtesting methods, whether manual or through automated forex backtesting platforms like MetaTrader, can at times prevent traders from properly evaluating strategies. Some of their minuses create barriers not only to automated trading but also to manual trading strategy validation and refinement.</p> <p><img alt="Manual Backtesting and Automated Backtesting (ThinkMarkets)" src="/getmedia/ba07077f-db71-4648-8ed9-76ab452b46f0/Academy-Forex-Backtesting-ZigZag-Trend-Continuation-Short-Trade-with-MACD-Confirmation-GBPUSD-1D-Chart-4.png" /></p> <p style="text-align: center;">Exiting Forex Backtesting Platforms Prevent Traders from Assessing Trading Strategies</p> <p>While manual backtesting proves too time-consuming and automated testing too complex, traders need a solution that combines the best of both worlds without the associated drawbacks.</p> <div> <style type="text/css">.didyouknow { display: block; background: #F1FDf0; width: 600px; border-radius: 20px; gap: 20px; padding-top: 48px; padding-right: 40px; padding-bottom: 48px; padding-left: 40px; font-family: Figtree; font-weight: 600; font-size: 22px; line-height: 140%; letter-spacing: 0%; } </style> </div> <div style="text-align: center;"> <style type="text/css">.btn { font: Figtree; justify-content: center; align-items: center; text-align: center; gap: 7px; font-style: normal; font-size: 18px; line-height: 24px; padding: 13px 20px; border: 1px solid #ddd; border-radius: 38px; background: #5EE15A; } </style> </div> <div class="didyouknow">Do you have a strategy but no access to fast, easy and reliable software?<br /> <br /> <a class="btn" href="/nz/traders-gym/" style="text-decoration: none; font-weight: 500; color: #000000; background: 5EE15A;" target="_blank">Try out Traders Gym here!</a></div> <h2>The Need for a Hybrid Forex Tester: Traders Gym</h2> <p>Today’s fast-paced forex trading demands a more efficient approach to backtesting forex strategies. Traders Gym by ThinkMarkets is an exclusive, semi-automated forex tester that allows beginner and advanced traders to evaluate their trading strategies through:</p> <ul> <li>Years of live market replay using tick data</li> <li>Real-time performance evaluation</li> <li>Incorporation of fixed spread costs</li> <li>Access to trade records to assess the forex strategy</li> <li>Multiple time frames to test your strategies across different markets</li> </ul> <h3>Traders Gym Free Forex Backtesting Software by ThinkMarkets</h3> <p>Traders Gym, the ThinkTrader backtesting software by ThinkMarkets:</p> <p><strong>Eliminates common barriers to effective strategy testing:</strong> Rather than requiring complex skills or endless hours of manual review, Traders Gym offers an intuitive interface that lets traders maintain decision-making while automating tedious tasks.</p> <p><strong>Simulates real trading conditions:</strong> At its core, Traders Gym simulates real trading conditions through accurate market volatility representation of recorded markets. This enables traders to evaluate their strategies in the live market conditions through the market replay free feature, at their preferred speed.</p> <p><strong>Extends beyond traditional desktop constraints:</strong> The free forex simulator for backtesting is accessible on mobile, tablet and desktop, allowing traders to test and refine their strategies anywhere.</p> <p><strong>Makes high-quality backtesting accessible:</strong> By bridging the gap between time-consuming manual methods and complex automated tools, Traders Gym makes high-quality backtesting accessible to traders of all types.</p> <p>Let's see how backtesting for free with Traders Gym works and helps traders improve their trading strategy development process.</p> <div> <style type="text/css">.didyouknow { display: block; background: #F1FDf0; width: 600px; border-radius: 20px; gap: 20px; padding-top: 48px; padding-right: 40px; padding-bottom: 48px; padding-left: 40px; font-family: Figtree; font-weight: 600; font-size: 22px; line-height: 140%; letter-spacing: 0%; } </style> </div> <div class="didyouknow">Start backtesting your forex strategies today with <a href="https://portal.thinkmarkets.com/account/individual/" target="_blank">Traders Gym</a></div> <h2>How Does Traders Gym Work?</h2> <p>Traders Gym works in a simulation environment through four key components:</p> <p>1. <strong>Market Replay Technology:</strong> Run your strategy on historical market movements with precise tick-by-tick replay over 5 years of available past market data. Pause, analyse, and learn from these real market movements to refine your strategy in better ways.</p> <p>2. <strong>Multiple Strategy Testing:</strong> Create up to 50 different simulations at a time and test various strategies across different timeframes and forex pairs. Traders Gym enables thorough strategy validation at an exact point in time, enabling the development of event-specific strategies.</p> <p>3. <strong>Complete Trading Experience:</strong> Access over 4,000 trading instruments across multiple asset classes, including indices, commodities and cryptocurrencies, not just forex. The forex trading simulator provides:</p> <ul> <li>Full technical indicator suite integrated with TradingView</li> <li>Start, pause, restart, slow down or fast forward to track individual trades</li> <li>Market but also pending (limit) orders for maximum efficiency</li> <li>Cross-asset backtesting to evaluate your strategy’s robustness</li> </ul> <p>4. <strong>24/7 Testing Environment:</strong> Test strategies anytime, even when markets are closed. Traders Gym offers:</p> <ul> <li>Chart saving functionality</li> <li>Easy transition to live trading</li> <li>Integration with the ThinkTrader web platform</li> </ul> <p>5. <strong>Trade Recording:</strong> The platform automatically tracks:</p> <ul> <li>Entry and exit points</li> <li>Position sizes</li> <li>Risk parameters</li> <li>Trade outcomes</li> <li>Performance metrics</li> </ul> <p><img alt="Forex Tester Alternative (ThinkMarkets)" src="/getmedia/906bc86e-c525-445b-a6c8-601c396dd519/Academy-Forex-Backtesting-ZigZag-Steeper-Angle-Produces-More-Gains-GBPUSD-1D-Chart-1.png" /></p> <p style="text-align: center;">Traders Gym Backtester Core Components</p> <p>The key components of Traders Gym offer traders a faster and more straightforward approach to backtesting.</p> <h2>Who in the Forex Market Benefits from Traders Gym?</h2> <p>Several <a href="/en/trading-academy/technical-analysis/method-to-analyse/">types of traders in the forex market</a> benefit from Traders Gym, each in their unique way. Here’s how a diverse range of traders leverage the TG’s features:</p> <p><img alt="Traders Gym Backtester Benefits (ThinkMarkets)" src="/getmedia/4b34763e-20c0-482e-9d17-fc92ec62f894/Academy-forex-backtesting-zig-zag-trend-continuation-short-trade-with-macd-confirmation-gbpusd-1d-chart-4-1-1.png" /></p> <p style="text-align: center;">Traders Gym Benefits Different Trader Profiles</p> <p>The modern features of Traders Gym make it a practical solution across different trading approaches. And it's easy to use TG. Let’s see how.</p> <div> <style type="text/css">.didyouknow { display: block; background: #F1FDf0; width: 600px; border-radius: 20px; gap: 20px; padding-top: 48px; padding-right: 40px; padding-bottom: 48px; padding-left: 40px; font-family: Figtree; font-weight: 600; font-size: 22px; line-height: 140%; letter-spacing: 0%; } </style> </div> <div style="text-align: center;"> <style type="text/css">.btn { font: Figtree; justify-content: center; align-items: center; text-align: center; gap: 7px; font-style: normal; font-size: 18px; line-height: 24px; padding: 13px 20px; border: 1px solid #ddd; border-radius: 38px; background: #5EE15A; } </style> </div> <div class="didyouknow">Thought backtesting is too time-consuming and complex?<br /> <br /> <a class="btn" href="https://portal.thinkmarkets.com/account/individual/" style="text-decoration: none; font-weight: 500; color: #000000; background: 5EE15A;" target="_blank">Try out Traders Gym</a></div> <h2>How to Start Backtesting FX in Traders Gym</h2> <p>Let's walk through the step-by-step process of <a href="/en/trading-academy/technical-analysis/traders-gym/">backtesting your FX strategy</a> in Traders Gym.</p> <br /> <iframe allow="accelerometer; autoplay; clipboard-write; encrypted-media; gyroscope; picture-in-picture; web-share" allowfullscreen="" frameborder="0" height="315" referrerpolicy="strict-origin-when-cross-origin" src="https://www.youtube.com/embed/kJ7pQM8g_EE?si=U63-RKgOYqmrnZcX" title="YouTube video player" width="560"></iframe> <h3>Step 1: Create New Simulation</h3> <p>If you have a <a href="/nz/thinktrader-account/">ThinkTrader account</a>, start by logging into the ThinkTrader web platform. Navigate to the Traders Gym icon on the left, bottom side of your screen and click the + icon to initiate a new simulation.</p> <p><img alt="ThinkTrader Backtest Forex (ThinkMarkets)" src="/getmedia/6e1ae133-4db2-446d-b5fa-764b4d36f2cd/Academy-forex-backtesting-zig-zag-trend-continuation-short-trade-with-macd-confirmation-gbpusd-1d-chart-5.jpg" /></p> <p style="text-align: center;">Traders Gym New Simulation</p> <div> <style type="text/css">.didyouknow { display: block; background: #F1FDf0; width: 600px; border-radius: 20px; gap: 20px; padding-top: 48px; padding-right: 40px; padding-bottom: 48px; padding-left: 40px; font-family: Figtree; font-weight: 600; font-size: 22px; line-height: 140%; letter-spacing: 0%; } </style> </div> <div class="didyouknow">No ThinkTrader account? Open your account and test Traders Gym for free <a href="https://portal.thinkmarkets.com/account/individual/demo/" target="_blank">here!</a></div> <h3>Step 2: Choose Currency and Historical Data</h3> <p>A new simulation will prompt you to select your preferred <a href="/en/trading-academy/forex/currency-pairs/">currency pair</a>. Once you choose it, you will be taken to the initial setup, where you can name your strategy, choose your timeframe, lookback period and trade date. For easy reference later, e.g., ‘EURUSD 1H backtest, 0724/25’, record also the lookback period to avoid confusion with other simulations. Click ‘Create’ and you will be taken to the interval, in this example 01072024.</p> <p><img alt="Trader Gym Forex Simulator (ThinkMarkets)" src="/getmedia/cb9f9af5-b6dc-4909-8ff3-f9da7f9391c9/Academy-forex-backtesting-zig-zag-trend-continuation-short-trade-with-macd-confirmation-gbpusd-1d-chart-6.jpg" /></p> <p style="text-align: center;">Traders Gym Simulation Setup</p> <h3>Step 3: Set up Trade and Risk Parameters on Backtest Chart</h3> <p>Before testing any trades, you need to access the order window by clicking on either the Buy or Sell button in the top right corner. Set your <a href="/en/trading-academy/forex/position-sizing-guide/">position size</a>, stop-loss, and take-profit levels based on your strategy rules and risk appetite, as well as the order type. Click ‘Confirm’ to sell or buy.</p> <p><img alt="Forex Practice Simulator (ThinkMarkets)" src="/getmedia/de4efbc9-e90c-4226-90bc-6a46413e6b74/Academy-forex-backtesting-zig-zag-trend-continuation-short-trade-with-macd-confirmation-gbpusd-1d-chart-8.jpg" /></p> <p style="text-align: center;">Traders Gym Trade Setup</p> <h3>Step 4: Run Simulation with the Bar Replay Function</h3> <p>In this example, Traders Gym will short 1000 units (0.01 lot) of EURUSD at 1.0850, with SL at 1.0875 and TP at 1.0800, when the simulation runs. You can ‘<a href="/en/trading-academy/forex/order-types/">Place Order</a>’ and then use the play button at the bottom to progress through price action candle by candle. Adjusting the playback speed (25x to 50x) or adding relevant indicators makes sense to ensure a rules-based approach.</p> <p><img alt="Forex Backtesting Simulator (ThinkMarkets)" src="/getmedia/c9aefbf2-4476-4b57-84e5-7956c6a0b9b7/Academy-forex-backtesting-zig-zag-trend-continuation-short-trade-with-macd-confirmation-gbpusd-1d-chart-9.jpg" /></p> <p style="text-align: center;">Trader Gym EURUSD Trade Simulation</p> <p>Traders Gym indeed opened a short position at the 1.0850 level, which led to a loss. No strategy rules were implemented for the sake of simplicity in this particular trade.</p> <h3>Step 5: Review Strategy Tester Performance</h3> <p>The simulated positions are all recorded in real time as they unfold. TG saves the instrument, order, amount, TP and SL, the open and closing dates, P&L, as well as the change in pips. This enables traders to evaluate their strategy performance once 100 trades or so are placed.</p> <p><img alt="Trade Ideas Backtesting (ThinkMarkets)" src="/getmedia/6baca0a3-a09c-4e98-9a12-4a0b1e6096a2/Academy-forex-backtesting-zig-zag-trend-continuation-short-trade-with-macd-confirmation-gbpusd-1d-chart-10.jpg" /></p> <p style="text-align: center;">Traders Gym Trading Record</p> <h3>Step 6: Refine Forex Strategy and Repeat</h3> <p>With every trade recorded and also visual clarity during execution, you can make the necessary adjustments to refine your strategy. This might involve tweaking entry rules, stop-losses or take-profits. You can run new simulations, validate these changes and only go live when the strategy has proven to work.</p> <div> <style type="text/css">.didyouknow { display: block; background: #F1FDf0; width: 600px; border-radius: 20px; gap: 20px; padding-top: 48px; padding-right: 40px; padding-bottom: 48px; padding-left: 40px; font-family: Figtree; font-weight: 600; font-size: 22px; line-height: 140%; letter-spacing: 0%; } </style> </div> <div style="text-align: center;"> <style type="text/css">.btn { font: Figtree; justify-content: center; align-items: center; text-align: center; gap: 7px; font-style: normal; font-size: 18px; line-height: 24px; padding: 13px 20px; border: 1px solid #ddd; border-radius: 38px; background: #5EE15A; } </style> </div> <div class="didyouknow">Ready to backtest and validate your forex strategy?<br /> <br /> <a class="btn" href="https://portal.thinkmarkets.com/account/individual/" style="text-decoration: none; font-weight: 500; color: #000000; background: 5EE15A;" target="_blank">Sign up now!</a></div> <h2>Tips and Best Practices For Best Forex Backtesting</h2> <p>Before starting your forex backtesting journey with Trader Gym, focus on these tips and best practices:</p> <p><strong>Strategy and Testing Environment:</strong> Start with clearly defined entry/exit criteria that work for your selected timeframe and forex pair. Create realistic conditions by including trading costs, proper position sizing as you would trade in real markets, and genuine stop-losses.</p> <p><strong>Market Analysis:</strong> Your forex strategy should prove effective across various market conditions to improve strategy robustness. Understand why a winning trade took place and test whether it reacts similarly in a different environment, especially when caught up in the middle of major economic events.</p> <p><strong>Documentation and Review:</strong> Keep detailed records of your testing process, including strategy parameters, market conditions, and any adjustments that improve performance. Some even keep screenshots of significant trading signals, as it helps identify patterns.</p> <p>On the one hand, this journaling process can be time-consuming, too. On the other hand, Traders Gym will tell you whether your strategy has good chances of succeeding either way. Whether you want to try TG depends on you.</p> <h2>Is Forex Backtesting with Traders Gym Right for You?</h2> <p>Traders Gym serves different trading styles and experience levels through its all-around backtesting tools. It benefits discretionary and technical traders who prefer visual clarity and analysis, and real-time validation. <a href="/en/trading-academy/technical-analysis/day-trading-chart-patterns/">Pattern recognition</a> traders can specifically practice pattern recognition and work on their setups in a risk-free environment that mirrors live trading conditions. Meanwhile, Intermediate traders can quickly iterate and refine existing strategies.</p> <p>If you're a new trader, you may appreciate the intuitive forex backtesting app that requires no coding skills and is easy to use on both <a href="/nz/thinktrader/">desktop and mobile</a>. The flexible access also supports traders recovering from drawdowns and can help with rebuilding confidence without risking capital.</p> <h2>Taking the Next Step?</h2> <p>Forex backtesting bridges a gap between trading ideation and strategy in a risk-free environment while combining the best of both manual and automated methods without the associated drawbacks.</p> <p>However, Traders Gym is not a one-off solution where forex traders can build and forget an effective strategy. It enables consistent refinement and improvement of strategies, tailored for the ever-changing world of forex.</p> <p>If you are serious about backtesting forex strategies, you can start with simple Traders Gym ideas and adjust them based on your results. But after going live, remember that Traders Gym is not just a tool to take a strategy from zero to profit. Its hybrid nature provides you, the trader, with access to continuous trading strategy backtests crucial for ongoing refinement.</p> <div> <style type="text/css">.didyouknow { display: block; background: #F1FDf0; width: 600px; border-radius: 20px; gap: 20px; padding-top: 48px; padding-right: 40px; padding-bottom: 48px; padding-left: 40px; font-family: Figtree; font-weight: 600; font-size: 22px; line-height: 140%; letter-spacing: 0%; } </style> </div> <div class="didyouknow">Ready to take the next step with <a href="/nz/traders-gym/" target="_blank">Traders Gym?</a></div>

Impact of Geopolitical Events on Forex Markets
<p>Forex markets require an adequate understanding of the impact geopolitical events can have on currency pairs, as they often react immediately when these high-risk events unwind. Geopolitical instability can sometimes even serve as a driver of currency volatility that can affect the value of major FX pairs from a mere 2% to a significant 18% over a period of a few months.</p> <p>Since major currencies often reflect the pressure of global geopolitical risks and trade tensions faster than other asset classes, geopolitical awareness is considered a necessity in forex trading. Forex traders must develop an ability to adequately interpret how geopolitics can affect the value of a currency to capitalise on price fluctuations while managing risks.</p> <p>In this piece, we will cover how geopolitical events impact foreign exchange markets and some practical approaches smart traders use to inform their trading decisions.</p> <p>In particular, we will talk about:</p> <ul> <li>Which geopolitical events matter most for forex markets</li> <li>How geopolitical events translate into currency fluctuations</li> <li>How to position yourself during geopolitical instability</li> <li>How to build a solid framework for geopolitical analysis to guide your trading decisions</li> </ul> <h2>What Are Geopolitical Events in Forex Trading</h2> <p>Geopolitical events are major political developments like wars, elections, trade tensions or sovereign crises that ripple through economies and impact currencies. These events matter because they can instantly change investor sentiment and move capital across borders, which in turn affects currency values and <a href="/en/trading-academy/forex/what-is-forex-trading/">forex trading</a>.</p> <p>Currencies react to them because they are tied to confidence and capital flows. When a country confronts trouble, investors rapidly dump the country’s currency for safer options like the dollar, the Japanese yen, or <a href="/en/trading-academy/commodities/what-is-gold-trading-why-trade-gold/">gold</a>. That's why geopolitical events can send the value of a currency into a tailspin immediately and spark market volatility in a matter of seconds.</p> <p>Some geopolitical events have a long-standing impact. When trade patterns between countries are disturbed and investment flows shift, currency relationships can change. In turn, this may result in longer-term trends.</p> <p>A <a href="https://pmc.ncbi.nlm.nih.gov/articles/PMC9188658/" target="_blank">study</a> on COVID by the National Library of Medicine, in fact, found that bank interventions have shortened the duration of high-risk effects. Yet, major forex currencies like the Euro, Pound, Aussie and others, ranged from 2% to 18% in a short period of just three months compared to years following the Global Financial Crisis (GFC).</p> <p>This goes to tell that not all geo-political events have the same impact. Routine elections, for instance, may cause temporary volatility in major pairs unless the results come as a surprise, as they are somewhat priced in. Other events, like geopolitical tensions, wars, or crises, can strike the markets without warning. Their exceptional nature, rarity, uncertain duration and magnitude can trigger significant movements.</p> <h2>Types of Geopolitical Events and Impact on the Forex Market</h2> <p>Some geopolitical events come in a surprising fashion and can impact forex markets in meaningful ways. These high-risk events bear real economic consequences that affect investor confidence, as they can directly impact capital flows into and out of currencies and alter trade balances.</p> <p>However, the impact a geopolitical event can have on the forex markets is tied to several key drivers that traders must pay attention to. Primarily, there are four major geopolitical events that affect forex markets and their related currencies most.</p> <p><img alt="Major Geopolitical Events Impacting Forex Markets (ThinkMarkets)" src="/getmedia/5b96bb38-d13f-49ad-a2fa-ece9a8719049/Academy-Forex-Geopolitics-ZigZag-Steeper-Angle-Produces-More-Gains-GBPUSD-1D-Chart-1.png" /></p> <p style="text-align: center;">Four Major Geopolitical Events Affecting Forex Markets</p> <p><strong>1. Military Conflicts and Security Crises</strong> are among the most direct ways to influence currencies. They shake confidence, disrupt economies, and lead to a flight to safety. During these events:</p> <ul> <li>Currencies of the involved nations typically depreciate</li> <li>Safe-haven currencies like <a href="/nz/us-dollar-index/">USD</a>, <a href="/nz/usd-jpy/">JPY</a>, and <a href="/nz/usd-chf/">CHF</a> strengthen</li> <li>Regional currencies often experience spillover effects</li> <li>Commodity markets (especially <a href="/nz/crude-oil-wti/">oil</a> and <a href="/en/trading-academy/commodities/how-to-trade-gold-a-short-guide/">gold</a>) surge, affecting <a href="/en/trading-academy/commodities/what-are-commodities/">commodity</a> currencies</li> </ul> <p><strong>2. Elections and Regime Changes</strong> bring market uncertainty, especially if they lead to policy events that impact trade or the economy. Investors and traders alike typically fail to manage geopolitical instability well, so currencies can swing wildly. During elections:</p> <ul> <li>Anticipation can cause pre-vote positioning and post-result repricing</li> <li>Surprise outcomes can trigger significant one-day currency moves</li> <li>Policy uncertainty creates volatility that can last weeks or months</li> <li>Currency pairs can penetrate new trading ranges based on expected policy direction</li> </ul> <p><strong>3. Trade Wars and Sanctions</strong> can change trade flows and impact currency demand. Evidently, in a geopolitical landscape filled with <a href="/en/trump-tariffs/">trade tensions</a>:</p> <ul> <li>Targeted currencies typically weaken following the announcement of economic sanctions</li> <li>Trade-dependent currencies become more sensitive to escalations</li> <li>Currency pairs find new equilibria based on changing trade patterns</li> <li>Volatility often rises during negotiation periods as market uncertainty spikes</li> </ul> <p><strong>4. Global Crises</strong> can squeeze liquidity and investor confidence. These high-risk events can spark a flight to safety, forcing traders out of risky assets. Specifically:</p> <ul> <li>Emerging market currencies depreciate, at times by more than double digits</li> <li>Safe-haven flows into gold, then Yen, Swiss Franc and the Dollar increase</li> <li>Liquidity conditions worsen, which causes spreads across FX pairs to widen</li> <li>Currency correlations between forex pairs and risk assets strengthen</li> <li>Central bank interventions, even collective, become more likely, adding to currency volatility</li> </ul> <p>Let’s flash back to some of history’s most significant geopolitical events and try to understand their impact on currencies.</p> <h2>Examples of Geopolitical Events in Forex Markets</h2> <p>Markets have a long memory, and history reminds us that geopolitics can impact currency markets in surprising ways. Below, the theoretical categorisation becomes much clearer when we examine specific historical geopolitics examples and their measurable impact on currency appreciation or depreciation.</p> <h3>Military Conflicts</h3> <p>Military conflicts (or wars) often cause immediate and severe market reactions, especially for currencies involved in the conflict. The unpredictability and potential for escalation make these events particularly powerful market movers.</p> <p><strong>The Russia-Ukraine conflict (2022)</strong> sent the <a href="/nz/eur-usd/">EUR/USD</a> down nearly 4% in a matter of two weeks, while USD/RUB saw swings of almost 20% as traders reassessed energy risk and trade flows.</p> <p><img alt="EURUSD Russia-Ukraine Crash (ThinkMarkets)" src="/getmedia/f7e5d42e-de6b-4ab3-a098-91d4c42bdaf0/Academy-Forex-Geopolitics-ZigZag-Trend-Continuation-Short-Trade-with-MACD-Confirmation-GBPUSD-1D-Chart-3.png" /></p> <p style="text-align: center;">EURUSD Lost over 4% in Two Weeks when the Russia-Ukraine Conflict Began</p> <p>Middle East conflicts caused investors to buy safe currencies like the US dollar and Swiss franc.</p> <h3>Elections and Regime Changes</h3> <p><strong>The Brexit Referendum (2016)</strong> sent <a href="/nz/gbp-usd/">GBP/USD</a> tumbling by more than 8% in a single day as traders priced in economic uncertainty. It continued falling for months due to pessimism surrounding the UK’s economic prospects, registering a nearly 20% currency depreciation.</p> <p><img alt="GBPUSD Brexit Crash (ThinkMarkets)" src="/getmedia/6c8d668a-6e28-43d6-bc59-e304dd61078c/Academy-Forex-Geopolitics-ZigZag-Trend-Continuation-Short-Trade-with-MACD-Confirmation-GBPUSD-1D-Chart-4.png" /></p> <p style="text-align: center;">GBPUSD Brexit Crash Takes Cable ~20% Lower in Months</p> <p><strong>US Presidential Elections (2016, 2020, 2024)</strong> are always a wildcard, shifting expectations for the dollar depending on policy promises.</p> <p><strong>Emerging Market Political Transitions (2015, 2017)</strong> cause currency volatility as traders reassess political stability. For example, <a href="https://www.theguardian.com/business/2015/dec/10/south-africa-finance-minister-nene-departure-drives-rand-down-to-all-time-low" target="_blank">South Africa replaced its finance minister</a> overnight in 2015, or Brazil’s corruption scandals in politics.</p> <h3>Trade Disputes</h3> <p><strong>The US Trade War with China (2018-2020)</strong> caused the USD/CNY pair to see big swings as much as 0.4% after Trump’s tariff announcements, as tariffs hit growth expectations. Tariff announcements quickly hit trade-sensitive currencies like the <a href="/nz/usd-cad/">CAD</a> and <a href="/nz/aud-usd/">AUD</a>, turning tariffs into a full-blown currency war.</p> <p><strong>The “<a href="/en/market-news/liberation-day-meaning-and-portfolio-impact/">Liberation Day</a>” Rout (2025)</strong> in April wiped out over <a href="https://www.ajbell.co.uk/news/which-countries-markets-have-recovered-liberation-day#:~:text=The+market+fall,the+FTSE+All-World+index." target="_blank">$8 trillion in market value</a> from global markets as US President Donald Trump announced tariffs far worse than expected. The Japanese Yen rose around 6% against the US dollar in less than three weeks' time.</p> <p><img alt="USDJPY Liberation Day Crash (ThinkMarkets)" src="/getmedia/d82aeab2-59de-4e3e-b415-31e543871735/Academy-Forex-Geopolitics-ZigZag-Trend-Continuation-Short-Trade-with-MACD-Confirmation-GBPUSD-1D-Chart-5.png" /></p> <p style="text-align: center;">USDJPY Drops ~6% in Just 3 Weeks Following “Liberation Day” Tariffs</p> <h3>Global Economic Crises</h3> <p><strong>The COVID-19 Pandemic (2020)</strong> caused a 10% rise in USD in less than a month as liquidity dried up and risk appetite disappeared. Emerging currencies, such as the Mexican Peso, tumbled 30% in a matter of four weeks.</p> <p><img alt="COVID Crashes Emerging Market Currencies (ThinkMarkets)" src="/getmedia/d4a193e2-0ef2-4a2d-91d2-e89ec65365b5/Academy-Forex-Geopolitics-ZigZag-Trend-Continuation-Short-Trade-with-MACD-Confirmation-GBPUSD-1D-Chart-6.png" /></p> <p style="text-align: center;">USDMXN Soars ~30% during the COVID Pandemic in just 4 Weeks</p> <p><strong>The Global Financial Crisis (2008)</strong> saw the US dollar index (DXY) jump 11% for the year as investors ran to safety.</p> <p><strong>The Energy Crisis (2014-2015)</strong> reshaped currency flows between oil exporters and importers (energy prices go up > exporters’ currencies gain value > importers’ currencies lose value).</p> <p>These historical examples of geopolitics show just how quickly and dramatically geopolitical developments can move currency markets. To understand why these shifts happen and how traders can respond, it is essential to look at the mechanisms that connect geopolitical events to forex price movements.</p> <h2>Why Geopolitical Events Influence the Forex Markets</h2> <p><a href="/en/trading-academy/forex/how-to-trade-forex/">Geopolitical events move forex markets</a> because they alter investor expectations attached to currencies, creating immediate reactions primarily through four transmission mechanisms:</p> <p><strong>1. Risk Premium:</strong> During times of increased geopolitical instability, traders demand a higher market risk premium to hold currencies sensitive to high risk. This repricing happens so fast that it usually drives currency volatility immediately.</p> <p><strong>2. Capital Flows:</strong> Capital flees during geopolitical tensions toward perceived safety or opportunity, depending on the actors behind capital flows. When the impact of geopolitical risks accelerates, investor repositioning leads to reallocations that significantly impact currency exchange rates.</p> <p><strong>3. Trader Psychology:</strong> Fear and greed aggravate currency fluctuations during high-risk events, pushing prices beyond levels that fundamentals alone would justify. As a result, market sentiment deteriorates, giving birth to both opportunities and risks in forex.</p> <p><strong>4. Economic Transmission Channels:</strong> Geopolitical developments impact currencies through several economic channels:</p> <ul> <li>Geopolitical tensions directly influence forex currency demand through changing export/import dynamics</li> <li>Political shifts alter investment flows and inflation expectations in affected economies</li> <li>Government fiscal responses to crises can raise questions about debt sustainability, affecting currency valuation</li> </ul> <p>When geopolitical uncertainty rises in the forex market, traders reassess which currencies they want to hold based on their risk perception. In turn, this creates noticeable volatility and price patterns that can determine how the forex market may react to global events.</p> <p>Some of these geopolitical impacts are so adverse that they often trigger central bank responses. This can create a second wave of currency movements as policymakers attempt to stabilise markets in order to protect economic growth and consumers.</p> <h2>Role of Central Banks amid the Impact of Geopolitical Crises</h2> <p>Central banks may have to step in to stabilise currency markets and restore investor confidence at times of increased geopolitical tensions or in the aftermath of high-risk events. However, when they intervene, their actions can calm markets as much as they can increase currency volatility.</p> <p>During critical geopolitical situations, central banks may generally respond in the following ways:</p> <ul> <li><strong>Direct Intervention (e.g. BOJ 2022 Intervention):</strong> Intervene directly by buying or selling their own currency in the forex markets to offset disorderly moves.</li> <li><strong>Interest Rate Adjustment (e.g. Fed Cuts Rates amid Covid):</strong> Adjust policy rates (cuts/hikes) in an emergency move to shift currency valuations.</li> <li><strong>Liquidity Provision (e.g. Fed $450bn Covid Line):</strong> Implement liquidity measures through currency swap lines to manage currency volatility and ensure orderly market functioning.</li> <li><strong>Forward Guidance (e.g. ECB “whatever it takes”):</strong> Use forward guidance in public statements as a communication tool to shape market expectations around future monetary policy.</li> <li><strong>Coordinated Action (e.g. G7 Japan 2011 Earthquake):</strong> Coordinate with other central banks to address global risks, especially when global financial stability is at risk.</li> </ul> <p>Geopolitical disruptions can push central banks to the corner, causing them to deploy tools to stabilise markets, but not all interventions are successful. For example, following Russia's invasion of Ukraine, the central bank of Russia hiked its interest rates to 20% from 9.5% after the ruble crashed 30% against the dollar. Despite the currency recovering in the following weeks, it came at an enormous economic cost.</p> <p>On the one hand, diverging central bank policies create unique trading opportunities for traders chasing yields, particularly when geopolitical events cause different responses across economic regions. On the other hand, coordinated actions, like swap lines or joint policy announcements, tend to have more impact than unilateral moves, which can struggle to get market confidence.</p> <p>Understanding these market dynamics gives forex traders an edge in anticipating both immediate price movements and longer-term market trends as markets adjust to new realities.</p> <h2>Which Assets Move from the Impact of Geopolitical Events</h2> <p>As explained, in times of geopolitical stress, it is important to look across the board to see which assets are moving and why. Below, we have prepared a table including the assets, events and real examples:</p> <p><img alt="Geopolitical Impact on Asset Classes (ThinkMarkets)" src="/getmedia/3604efbf-b211-4637-a025-3d27fe0d1a03/Academy-Forex-Geopolitics-ZigZag-Trend-Continuation-Short-Trade-with-MACD-Confirmation-GBPUSD-1D-Chart-7.png" /></p> <p style="text-align: center;">Several Asset Classes Move During Geopolitical Events</p> <p>Due to the nature of financial markets, geopolitical events can cause spillover effects, affecting more than just one market. This is why forex traders should make themselves familiar with currency pair correlations.</p> <h3>Cross-Asset Correlations During Geopolitical Events</h3> <p>Cross-asset correlations from forex to equities and vice versa can play an important role in the interconnected modern markets. During risk-off episodes, bonds, equities, and currencies may move together in predictable patterns and create opportunities across different markets.</p> <p>For instance, the correlation between EUR/USD and <a href="/nz/us-spx-500-index/">S&P 500</a> typically strengthens during geopolitical crises, with both declining together as investors seek safety in the dollar. Yet, during global crises, the GBP/USD pair is often more volatile than EUR/USD due to the modest liquidity of the pound in comparison to the euro and the UK economy's greater sensitivity to global trade disruptions.</p> <p>Despite cross-asset correlation creating opportunities, all trading activities carry a significant risk of loss, especially when involving highly volatile geopolitical risks in forex. These types of risk require strict management and adherence to rules.</p> <h2>How to Manage Geopolitical Risk in Forex in 5 Steps</h2> <p>Although market volatility increases during geopolitical events, traders can still manage forex trading risks through a systematic step-by-step approach:</p> <h3>Step 1 - Adjust Position Sizing</h3> <p>During periods of increased geopolitical risk, reducing position sizes to risk no more than 0.5-1% of trading capital per trade can help maintain one’s account. Consider scaling out of positions at 50% reductions.</p> <h3>Step 2 - Implement Hedging Strategies</h3> <p>Hedging can act as a <a href="/en/dynamic-leverage-tiers/">protection tool</a> during geopolitical events. Hedges across currencies can help limit downside risk and allow traders to stay in a FX trade. An example would involve holding EUR/USD and hedging (taking the opposite position) a small USD/CHF position to offset potential losses in case the euro witnesses weakness.</p> <h3>Step 3 - Widen Stop-Losses</h3> <p>Placing stop losses is mandatory for protecting one’s trading capital, not just when geopolitical volatility increases, but all the time. During highly volatile geopolitical events, consider widening your stops or utilising the <a href="/en/trading-academy/indicators-and-patterns/atr-indicator/">ATR</a>, which takes into account volatility.</p> <h3>Step 4 - Diversify Currency Exposure</h3> <p>Diversifying trades across currency pairs can help traders avoid overexposure to a single currency. Imagine halving a typical 1 lot into two with different currency pairs that have little correlation between them, like the EUR/USD and <a href="/nz/aud-jpy/">AUD/JPY</a>.</p> <h3>Step 5 - Scenario Planning</h3> <p>Traders can incorporate scenario planning into their trading strategy. Consider developing at least three potential outcomes for major geopolitical events (best-case, expected-case, worst-case) and plan trading responses for each.</p> <p>Without a doubt, currencies act when geopolitical risks are on the rise and flows spill over into other asset classes. Tools like <a href="/en/trading-academy/technical-analysis/traders-gym/">Traders’ Gym can help traders test forex strategies</a> specifically designed for trading high-impact events at no risk.</p> <h2>Staying Ahead of Geopolitical Events</h2> <p>Geopolitical awareness has become indispensable for forex traders in global markets these days. Smart traders don't just rely on <a href="/en/trading-academy/technical-analysis/definition-charts-and-strategy-method/">technical analysis</a> or <a href="/en/trading-academy/technical-analysis/day-trading-chart-patterns/">chart patterns</a>. They monitor political developments to understand how they affect market sentiment, currency valuations and capital flows.</p> <p>But the evidence is clear. Currencies do respond to geopolitical events faster and more dramatically than almost any other asset class. From the Brexit-induced plunge to the ruble crash during the Ukraine conflict, these moves in forex markets create both risks and opportunities for traders positioned to capitalise on market dislocations.</p> <p>Geopolitical events and forex require integrating a systematic framework in your trading strategy to steer geopolitically driven markets. <a href="/en/trading-academy/">ThinkMarkets provides traders with important resources</a>, including real-time geopolitical news feeds, expert analysis, and advanced risk management tools specifically designed for volatile trading conditions.</p>
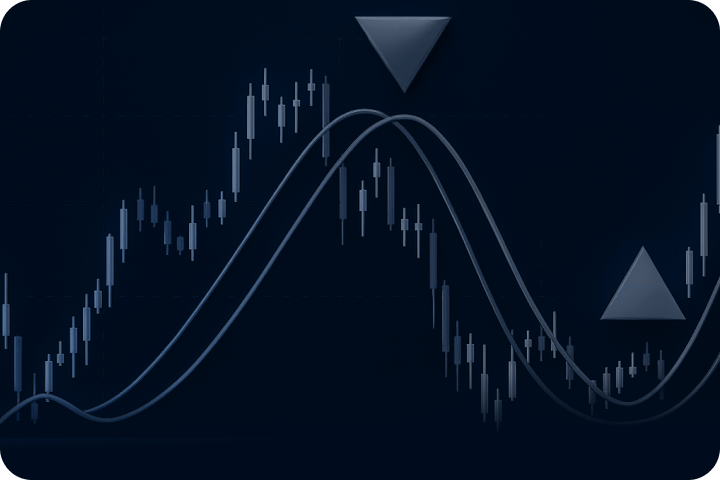
Moving Averages in Forex Trading: A Short Guide
<p>Moving averages in forex trading are among the most popular technical indicators for trend analysis. Their effectiveness as trend indicators is verified by a remarkable 12.32% annual return, according to the Taiwan Economic Journal (TEJ).</p> <p>At its core, the trend following indicator calculates the average price of an asset over a specified period. It then prints a smooth line that helps trend traders identify the direction of forex trends, filter out price noise, and generate moving average trading signals through dynamic support and resistance levels.</p> <p>This guide walks you through everything you need to know about moving average trading, from fundamental concepts to practical applications of the trend trading indicator. Whether you are new to forex markets or looking to refine your moving average strategy, you will learn:</p> <ul> <li>How different types of moving averages work and when to use them</li> <li>How to select the most effective moving averages for your trading style</li> <li>The four key moving average trading signals and how they help forex traders</li> <li>A 3-step process for integrating a trend following moving average into your strategy</li> <li>Common pitfalls to avoid when trading with moving averages and how to master them</li> </ul> <div> <style type="text/css">.didyouknow { display: block; background: #F1FDf0; width: 600px; border-radius: 20px; gap: 20px; padding-top: 48px; padding-right: 40px; padding-bottom: 48px; padding-left: 40px; font-family: Figtree; font-weight: 600; font-size: 22px; line-height: 140%; letter-spacing: 0%; } </style> </div> <div style="text-align: center;"> <style type="text/css">.btn { font: Figtree; justify-content: center; align-items: center; text-align: center; gap: 7px; font-style: normal; font-size: 18px; line-height: 24px; padding: 13px 20px; border: 1px solid #ddd; border-radius: 38px; background: #5EE15A; } </style> </div> <div class="didyouknow">Ready to Dive into Moving Averages in Forex?<br /> <br /> <a class="btn" href="https://portal.thinkmarkets.com/account/individual/demo/" style="text-decoration: none; font-weight: 500; color: #000000; background: 5EE15A;" target="_blank">Test your Strategy at No Risk Now!</a></div> <h2>What is the Moving Average in Forex Trading</h2> <p>The moving average (MA) is a trend-following indicator used in <a href="/en/trading-academy/forex/how-to-trade-forex/">forex trading</a> to identify the direction of the current trend by using historical price movements. The average moves as soon as the new price is available at the candle close.</p> <p>Note: We cover trend trading indicators specifically for trading in our article, which identifies the top 10 trend indicators as well. Read it <a href="/en/trading-academy/technical-analysis/trend-trading-indicators-for-forex/">here</a>.</p> <p>Forex MAs are lagging trend indicators and always follow price, never lead it. This lag causes a delay, as the formula takes past prices to calculate the average. The longer the period, the greater the lag. But despite their lagging nature, <a href="https://studylib.net/doc/10342340/the-profitability-of-technical-analysis--a-review-by" target="_blank">64% of forex dealers rely on MAs</a> in forex for analysis.</p> <h3>Moving Average Formula</h3> <p>The moving average indicator employs an arithmetic mean to calculate the average price over a specific period. The formula to calculate an MA is:</p> <p style="text-align: center;"><strong>MA = Sum of prices over period / Number of periods</strong></p> <p>For example, a 20-day MA line shows the average price of an asset over the last twenty days. The price for each new day replaces the price for the oldest day.</p> <p>Looking at the forex MA chart example below:</p> <p><img alt="EURUSD Moving Average (ThinkMarkets)" src="/getmedia/b3c75d50-f2cd-40e7-9cd8-d6cc8cfdf962/Academy-Forex-Moving-average-in-Forex-ZigZag-Trend-Continuation-Short-Trade-with-MACD-Confirmation-GBPUSD-1D-Chart-3.jpg" /></p> <p style="text-align: center;">EURUSD 20-Day Moving Average Chart, 1D Timeframe</p> <p>The blue, smooth line represents the 20-day moving average. The upward slope of the moving average line indicates a bullish trend, whether measured on the past 20 periods or the chart view.</p> <h2>Why Forex Traders Use Moving Averages</h2> <p>Forex traders use MAs in technical analysis for four key purposes:</p> <ol> <li><strong>Identify Market Type</strong></li> <li><strong>Confirm Trend Direction</strong></li> <li><strong>Assess Market Volatility</strong></li> <li><strong>Optimise Trading Time</strong></li> </ol> <p><img alt="Why Traders Use Moving Averages (ThinkMarkets)" src="/getmedia/8f1dd827-2d23-4dd1-86d6-a0b405ba0eff/Academy-Forex-Moving-average-in-Forex-ZigZag-Steeper-Angle-Produces-More-Gains-GBPUSD-1D-Chart-1.png" /></p> <p style="text-align: center;">Why Use Moving Averages in Forex Trading</p> <p>Let's examine each type in detail:</p> <h3>1. Identify Market Type</h3> <p>Moving averages excel at identifying the market type by helping traders quickly determine whether a forex pair is trending or ranging. When the price stays above key MAs over time, it confirms an uptrend, while prices below key MAs indicate a downtrend. During consolidation phases, the price tends to wobble around the moving average, and the MA line is flat.</p> <h3>2. Confirm Trend Direction</h3> <p>Moving averages help validate forex trends by confirming momentum and filtering out false breakouts. Trading setups have a higher probability when moving with the direction of the trend, substantiating the popular adage “the trend is your friend.”</p> <h3>3. Assess Market Volatility</h3> <p>Traders can assess market volatility by measuring the distance between the price and the moving average or how strong a trend is. When they start to deviate, they signal potential trend continuations. However, large deviations often hint at potential exhaustion and trend reversals, while a price close to the MA indicates weaker momentum and lower volatility.</p> <h3>4. Optimise Trade Time</h3> <p>Moving averages can optimise trade timing by providing clear entry, stop-loss, and take-profit levels. Traders can enter trend trades using MA breakouts or MA crossovers, while longer-period MAs help determine stop-loss and take-profit levels.</p> <h2>Different Types of Moving Average Indicators</h2> <p>Traders often find selecting a moving average overwhelming due to the many variations available. While some prefer using popular MA types, others build trend following strategies around more advanced versions.</p> <p>The table below provides a summary of how the most popular moving averages work and their best applications.</p> <p><img alt="Best Moving Average Forex (ThinkMarkets)" src="/getmedia/e817d1cd-be9a-40ad-b64e-18e7fbcb0569/Academy-Forex-Moving-average-in-Forex-ZigZag-Trend-Continuation-Short-Trade-with-MACD-Confirmation-GBPUSD-1D-Chart-7.png" /></p> <p style="text-align: center;">Most Popular Moving Averages in Forex Trading</p> <h3>Simple Moving Average (SMA)</h3> <p><a href="/en/trading-academy/forex/simple-moving-averages/">The SMA indicator</a> is the foundation of all moving averages, giving equal weight to each price point in the calculation period. Popular for long-term trend analysis, the SMA 10, SMA 20, SMA 50, SMA 100 and SMA 200 forex indicators react less to price changes, helping trend traders filter false signals and identify sustained trends.</p> <h3>Exponential Moving Average (EMA)</h3> <p>EMAs mathematically assign more weight to recent price action while exponentially decreasing weight for older prices. This quick reaction (2-3 times faster than SMAs) to price changes makes them ideal for short-term trading, with the 5-, 9-, 12-, 14-, 18-, and 21-period EMAs being particularly popular among trend traders.</p> <h3>Weighted Moving Average (WMA)</h3> <p>Similar to EMA, but it uses a linear weighting method, where the WMA assigns more weight to recent periods. This makes it a middle ground between SMAs and EMAs, offering a balanced approach to price change reactions.</p> <h3>Advanced Moving Averages</h3> <p>Moving averages can serve as trend confirmation indicators for various trading strategies. Advanced MA variations include:</p> <ul> <li><strong>Triangular Moving Average (TMA):</strong> Places more weight on middle periods using double-smoothed SMA to reduce false signals in choppy markets</li> <li><strong>Volume Weighted Average (VWMA):</strong> Weights prices based on trading volume, particularly useful in high-volume markets</li> <li><strong>Hull Moving Average (HMA):</strong> Combines longer and shorter WMAs for responsive price tracking, reducing lag while maintaining smoothness</li> <li><strong>Wilder's Moving Average:</strong> Similar to EMA but with slower reaction</li> <li><strong>Double Exponential Moving Average (DEMA) & Triple (TEMA):</strong> Advanced EMAs using multiple calculations to reduce lag while maintaining accuracy</li> </ul> <p>The effectiveness varies across different market conditions and moving average trading strategies. To select an appropriate type for your trading approach, focus on numerical results rather than opinions.</p> <div> <style type="text/css">.didyouknow { display: block; background: #F1FDf0; width: 600px; border-radius: 20px; gap: 20px; padding-top: 48px; padding-right: 40px; padding-bottom: 48px; padding-left: 40px; font-family: Figtree; font-weight: 600; font-size: 22px; line-height: 140%; letter-spacing: 0%; } </style> </div> <div style="text-align: center;"> <style type="text/css">.btn { font: Figtree; justify-content: center; align-items: center; text-align: center; gap: 7px; font-style: normal; font-size: 18px; line-height: 24px; padding: 13px 20px; border: 1px solid #ddd; border-radius: 38px; background: #5EE15A; } </style> </div> <div class="didyouknow">Want to See How Different Moving Averages Perform on Live Charts?<br /> <br /> <a class="btn" href="/nz/traders-gym/" style="text-decoration: none; font-weight: 500; color: #000000; background: 5EE15A;" target="_blank">Try Out Backtesting Tool Here!.</a></div> <h2>How to Choose a Moving Average to Trade Forex</h2> <p>Choosing the right moving average depends on your trading style, timeframe, and market conditions.</p> <p><img alt="Best Moving Average for Forex Trading (ThinkMarkets)" src="/getmedia/c8ce878f-4b9c-4fcc-9c17-44caf4a22504/Academy-Forex-Moving-average-in-Forex-swing-indicator.png" /></p> <p style="text-align: center;">What Are the Best Moving Averages Periods for Different Trading Styles</p> <p>Let's explore the best combinations for different trading approaches and conditions:</p> <h3>Short-Term: Day Trading and Scalping</h3> <p>Shorter–term moving average periods offer quick responses to price changes, including trend reversals, but traders should be aware that they may generate more noise signals. When <a href="/en/trading-academy/forex/day-trade/">day trading</a> or scalping, consider:</p> <ul> <li>The 5-MA serves as an immediate trend trading indicator, while the 9-MA confirms a breakout.</li> <li>1-15 minute charts</li> <li><strong>Special Cases:</strong> Hull MA for volatile pairs like GBPJPY</li> </ul> <h3>Medium-Term: Swing Trading</h3> <p>Longer periods are more suitable for confirming trend direction and serving as support and resistance levels. Focus on:</p> <ul> <li>20-50 period MAs (preferably SMAs)</li> <li>20-MA for intermediate trends</li> <li>50-MA for major support/resistance (institutional focus)</li> <li>1-4 hour charts</li> </ul> <p>The 34-MA (Fibonacci-based) often serves as an initial profit target, while the 50-MA helps distinguish between trend reversals and brief retracements.</p> <h3>Long-Term: Position Trading</h3> <p>Longer-term moving averages are used to identify the overall market trend direction and filter out shorter-term noise. Take into account:</p> <ul> <li>100-200 period SMAs</li> <li>100-MA as a midpoint indicator</li> <li>200-MA as a major trend indicator (~200 trading days per year)</li> <li><strong>Alternative:</strong> 89-EMA for faster-trending markets</li> </ul> <p>Alternatives between 100 and 200-MAs are typically Fibonacci-based numbers, such as the 144, as well as the tenfold multiples of 12, 14, and 18, i.e., the 120, 140, and 180 MAs.</p> <p>For Different Market Conditions:</p> <ul> <li><strong>Volatile Markets:</strong> Use Hull MA or DEMA/TEMA for reduced lag</li> <li><strong>Ranging Markets:</strong> Longer periods help filter noise</li> <li><strong>Trending Markets:</strong> Multiple MA combinations work well</li> <li><strong>High-Volume Periods:</strong> Consider VWMA for volume-weighted decisions</li> </ul> <p>Additional Selection Factors:</p> <ul> <li>Use the Fibonacci sequence (5, 8, 13, 21, 34, 55, 89) for period selection</li> <li>Backtest different timeframes for historical effectiveness</li> <li>Consider asset volatility when choosing the MA type</li> <li>Align multiple timeframes to reduce false signals</li> <li>Match the MA selection with personal trading objectives</li> </ul> <h2>Core Moving Average Trading Signals</h2> <p>Moving averages generate four essential trading signals that help identify entries, exits and trend direction and strength:</p> <h3>Long and Short Entries</h3> <p>A major moving average, like the 20- or 50-period MAs in forex, serves as a pivot point. When the price remains above it, trend traders enter only long positions, while when it stays below, they only go for shorts. The transition between these conditions signals a shift in market sentiment.</p> <h3>Moving Average Crossovers</h3> <p>Two main moving average crossover signals guide traders, one for long and one for short positions:</p> <ul> <li><strong>Golden Cross (Longs):</strong> It is a bullish signal and occurs when a short-period MA crosses above the long-period MA</li> <li><strong>Death Cross (Shorts):</strong> It is a bearish signal that occurs when a short-period MA crosses below the long-period MA</li> </ul> <p>Forex traders typically use the 50-day moving average and 200-day moving average for crossovers. See an example of a crossing moving average:</p> <p><img alt="EURUSD Golden Cross MA (ThinkMarket)" src="/getmedia/6843939d-9efb-41ca-bb08-f72d2ad613b5/Academy-Forex-Moving-average-in-Forex-ZigZag-Trend-Continuation-Short-Trade-with-MACD-Confirmation-GBPUSD-1D-Chart-4.jpg" /></p> <p style="text-align: center;">EURUSD Golden Cross, Trend Continuation, 1H Chart</p> <p>However, short-term moving average crosses are also used in abundance.</p> <h3>Moving Average Support and Resistance Levels</h3> <p>Major MAs in forex act as dynamic support and resistance levels, attracting trading activity. These levels are continuously updated, resulting in bounces or rejections. Traders often combine them with static support/resistance levels or watch price action around these key MAs.</p> <h3>Trend Assessment</h3> <p>Traders gauge trend direction through price and MA relationships. When the price holds above a long-term moving average, such as the 200 MA, it indicates a sustained uptrend, while trading below suggests a bearish trend. The MA slope provides additional insight: a steeper angle implies stronger momentum.</p> <div> <style type="text/css">.didyouknow { display: block; background: #F1FDf0; width: 600px; border-radius: 20px; gap: 20px; padding-top: 48px; padding-right: 40px; padding-bottom: 48px; padding-left: 40px; font-family: Figtree; font-weight: 600; font-size: 22px; line-height: 140%; letter-spacing: 0%; } </style> </div> <div style="text-align: center;"> <style type="text/css">.btn { font: Figtree; justify-content: center; align-items: center; text-align: center; gap: 7px; font-style: normal; font-size: 18px; line-height: 24px; padding: 13px 20px; border: 1px solid #ddd; border-radius: 38px; background: #5EE15A; } </style> </div> <div class="didyouknow">Can You Spot Moving Average Signals in Real Market Conditions?<br /> <br /> <a class="btn" href="https://portal.thinkmarkets.com/account/individual/" style="text-decoration: none; font-weight: 500; color: #000000; background: 5EE15A;" target="_blank">Sign up for a ThinkTrader Account!</a></div> <h2>What is the Best Moving Average System in Forex Markets</h2> <p>While there's no universal "best" moving average system, specific moving average crossover strategies have proven more effective. A double exponential moving average (DEMA) system using 25- and 350-day periods generated a <a href="https://www.quantifiedstrategies.com/trend-following-trading-strategy/" target="_blank">return of 57.8% at a win rate of just 39%</a>.</p> <h3>Double Moving Average System: MA Crossovers</h3> <p>The two moving average system employs a faster MA with a slower one to achieve three key objectives:</p> <ol> <li>Entry signals when the price violates the faster MA</li> <li>Exit signals when the price tests the slower MA</li> <li>Identify shifts in momentum through crossovers</li> </ol> <p>For example, traders often use a 9-EMA for entry signals. When price moves above this level, it generates a buy signal with a profit target at a slower MA, like the 20 MA. Some traders expand this to multiple MAs like the 50-day moving average, 100, and 200 for triggers, while others use them as support/resistance and trend identifiers.</p> <h4>Example: EURUSD Double MA Crossover</h4> <p>The most actively traded forex pair responds well to the 20-day moving average crossing the 50-day SMA. When the price stays above both SMAs, traders look for long entries on pullbacks to these moving averages.</p> <p><img alt="EURUSD Double MA Trading (ThinkMarket)" src="/getmedia/ef5ee5c1-e0c2-4421-957e-79131c111b0a/Academy-Forex-Moving-average-in-Forex-ZigZag-Trend-Continuation-Short-Trade-with-MACD-Confirmation-GBPUSD-1D-Chart-5.jpg" /></p> <p style="text-align: center;">EURUSD Double Moving Average Chart (20,50), 1D Timeframe</p> <h4>Example: GBPJPY Double MA Crossover</h4> <p>This volatile pair performs better with the Hull moving average due to its sharp movements. A 13-HMA for entries combined with a 55-HMA for trend identification and support/resistance proves effective.</p> <p><img alt="GBPJPY Dual Hull Moving Average Trading Strategy (ThinkMarkets)" src="/getmedia/a7b9e0dc-9e4d-466c-9448-2103024f2cd6/Academy-Forex-Moving-average-in-Forex-ZigZag-Trend-Continuation-Short-Trade-with-MACD-Confirmation-GBPUSD-1D-Chart-6.jpg" /></p> <p style="text-align: center;">GBPJPY Double HMA Chart (13,55), 1D Timeframe</p> <p>However, traders also often combine MAs with complementary indicators.</p> <h3>Moving Average Combination with a Complementary Indicator</h3> <p>Adding complementary indicators to an MA strategy can help fine-tune entries and identify trend reversals more effectively. A study published on TEJ showed a <a href="https://www.tejwin.com/en/insight/rsi-moving-average/" target="_blank">12.32% annual gain</a> using moving averages and <a href="/en/trading-academy/technical-analysis/trend-trading-indicators-for-forex/">Relative Strength Index (RSI)</a> divergence, outperforming benchmark returns. However, trend reversals are closely related to mean reversions rather than trading trends.</p> <h2>How to Trade with Moving Averages (Step-by-Step)</h2> <p>A systematic approach to trading with moving averages, akin to a follow-the-trend strategy, involves three key steps for traders:</p> <h3>Step 1: Employ a Pre-Trade Checklist</h3> <p>Before entering a trade, verify market conditions:</p> <ul> <li>Check if markets are in a trend or consolidating, and avoid trades during ranges</li> <li>Use a short-period MA as your trigger, but confirm with longer periods like the 200-MA</li> <li>Confirm the trend bias in at least one higher timeframe, such as the 4H or 1D</li> <li>Note significant MA crossovers for trend strength assessment</li> <li>A narrowing distance between price and key MA indicates trend extension</li> </ul> <h3>Step 2: Enter Based on Several Signals</h3> <p>Enter trades only when multiple signals align</p> <ul> <li>Confirm trend alignment across different MAs and periods</li> <li>Support your analysis with price action, <a href="/en/trading-academy/forex/using-candlestick-patterns-in-forex-day-trading/">candlestick</a> and <a href="/en/trading-academy/technical-analysis/day-trading-chart-patterns/">chart patterns</a></li> <li>Pay attention to the frequency of MA-price convergence and divergence</li> <li>Use key MAs as dynamic support/resistance levels for pullback entries</li> <li>Calculate position size based on the distance between entry and stop-loss points</li> </ul> <h3>Step 3: Manage Trade Using Moving Averages</h3> <ul> <li>Manage your position using MA levels.</li> <li>Place your stop-loss below or above the violated MA and trail it alongside slower MAs in trending markets</li> <li>Consider partial profit-taking around major MA levels</li> <li>Watch for exit signals when faster MAs flatten or price violates your trigger MA</li> </ul> <h2>Moving Average Trend Following Strategy</h2> <p>Let's analyse a complete EURUSD trade using moving average death crossover on the daily chart.</p> <h3>EURUSD Death Cross Trading Strategy Example</h3> <h4>Trade Setup (September-October 2024) September 19:</h4> <p>In March 2024, the EURUSD price began consolidating before rising one last time to form a <a href="/en/trading-academy/indicators-and-patterns/double-top-reversal-pattern/">double top</a> near 1.1200, which ended in September 2024. The price closed below the 20- and 50-day moving averages, eventually forming a death cross on 15 October.</p> <p><img alt="EURUSD Death Cross (ThinkMarkets)" src="/getmedia/289500e5-e91d-4223-8d20-655c95e2e5c8/Academy-Forex-Moving-average-in-Forex-ZigZag-Trend-Continuation-Short-Trade-with-MACD-Confirmation-GBPUSD-1D-Chart-8.jpg" /></p> <p style="text-align: center;">EURUSD Moving Average Death Cross (20,50), 1D Chart</p> <p><img alt="EURUSD Death Cross Trade (ThinkMarkets)" src="/getmedia/84ecd713-7ef4-4ec0-b697-86a42768454d/Academy-Forex-Moving-average-in-Forex-Characterisirtcs-of-Forex-Day-Trading-ThinkMarkets.png" /></p> <p style="text-align: center;">EURUSD Death Cross Strategy Process</p> <div> <style type="text/css">.didyouknow { display: block; background: #F1FDf0; width: 600px; border-radius: 20px; gap: 20px; padding-top: 48px; padding-right: 40px; padding-bottom: 48px; padding-left: 40px; font-family: Figtree; font-weight: 600; font-size: 22px; line-height: 140%; letter-spacing: 0%; } </style> </div> <div style="text-align: center;"> <style type="text/css">.btn { font: Figtree; justify-content: center; align-items: center; text-align: center; gap: 7px; font-style: normal; font-size: 18px; line-height: 24px; padding: 13px 20px; border: 1px solid #ddd; border-radius: 38px; background: #5EE15A; } </style> </div> <div class="didyouknow">Want to Apply this Strategy to EURUSD with Raw Spreads as Low as 0.0?<br /> <br /> <a class="btn" href="/nz/zero-account/" style="text-decoration: none; font-weight: 500; color: #000000; background: 5EE15A;" target="_blank">Open a ThinkZero Account Here!</a></div> <h2>How to Get Started with Moving Averages</h2> <p>Moving averages can be overwhelming to select at first if they are used more than just trend tools, but a structured approach helps develop proficiency while avoiding common pitfalls. To get started, consider:</p> <p><strong>1. Initial Setup:</strong></p> <ul> <li>Set up no more than 2-4 MAs with different periods on the chart</li> <li>Assign a distinct colour to each MA and adjust the thickness for better recognition</li> <li>Create alerts for MA violations and crossovers to avoid missing opportunities</li> <li>Test custom settings of moving averages like period and applied price (open, close, high, low)</li> <li>Use commonly assumed best SMA indicator periods, like the MA20 and others</li> </ul> <p><strong>2. Practice with MAs:</strong></p> <ul> <li>Backtest simple strategies on different pairs and timeframes</li> <li>Practice recognising signals on live charts without trading</li> <li>Implement MA trades on a ThinkMarkets demo account</li> <li>Journal both successful and failed trade setups to find what works better</li> <li>Start with one pair at a time and then expand to other pairs</li> </ul> <p><strong>3. Common Mistakes:</strong></p> <ul> <li>Using MAs as standalone indicators, always combine them with other tools</li> <li>Failing to understand the lag factor, especially with longer periods</li> <li>Trading during flat markets when false signals are standard</li> <li>Not aligning timeframes to prevent conflicting signals</li> </ul> <h2>Advancing to Moving Average Mastery</h2> <p>The path to mastering moving averages in forex trading goes beyond a basic understanding of trend-following utility and knowing the common pitfalls of trading with indicators. As you progress, focus on continuous education and improving your trading skills.</p> <p>Begin by studying advanced concepts that adjust to changing market conditions and gaining a better understanding of institutional behaviour patterns to reduce lag in your trend analysis. Through consistent practice, refine your moving average strategy while considering integrating complementary tools, such as the RSI, to build a solid trend-following system. As you gain experience, you might slowly adapt moving averages to match your personality.</p> <p>To find success with moving average indicators, remember there is no such thing as the best MA; patience is necessary. Moving averages are lagging technical indicators and are best used as trend confirmation indicators rather than being employed in breakout strategies. Of course, the key is to develop a system that aligns with your risk tolerance and trading objectives. But always remind yourself that seeking quick gain often aligns with leading indicators, so perhaps mastering the art of trend trading with moving averages is not for you.</p> <div> <style type="text/css">.didyouknow { display: block; background: #F1FDf0; width: 600px; border-radius: 20px; gap: 20px; padding-top: 48px; padding-right: 40px; padding-bottom: 48px; padding-left: 40px; font-family: Figtree; font-weight: 600; font-size: 22px; line-height: 140%; letter-spacing: 0%; } </style> </div> <div style="text-align: center;"> <style type="text/css">.btn { font: Figtree; justify-content: center; align-items: center; text-align: center; gap: 7px; font-style: normal; font-size: 18px; line-height: 24px; padding: 13px 20px; border: 1px solid #ddd; border-radius: 38px; background: #5EE15A; } </style> </div> <div class="didyouknow">Ready to Implement Pro-Level MA Strategies in your Forex Trading?<br /> <br /> <a class="btn" href="https://portal.thinkmarkets.com/account/individual/" style="text-decoration: none; font-weight: 500; color: #000000; background: 5EE15A;" target="_blank">Start your Journey with a TradingView Awarded Broker Now!</a></div>
Spot Rate Guide: All Traders Need to Know About Spot Prices
<p>The spot rate is the current exchange rate for a digital currency, a forex currency, a commodity like gold or oil, or any other financial instrument that can be settled right away. At the market value, spot rate trading involves transactions that require settlement within two business days (T+2 settlement), although the exact timing can vary by asset class and market conventions. For example, some spot forex trades settle on a T+2 basis, while others, like certain equities, may settle on T+1.M/</p> <p>But how can spot traders use spot rates to shape their trading strategies? This article gives an overview of spot derivative products and how spot prices affect the financial markets. We look into:</p> <ul> <li>Spot rate definition and its significance in foreign exchange markets and commodities</li> <li>Key distinctions between forward and spot CFD instruments</li> <li>Strategic uses of spot markets during periods of volatility and macroeconomic shifts</li> <li>Step-by-step guidance for executing spot trades effectively through trading platforms</li> </ul> <p>Let’s start with the basics and understand the definition of spot rate and how it works across different markets.</p> <p><strong>Don’t know about the different types of instruments? Learn more in <a href="/en/trading-academy/">ThinkMarkets Academy</a>!</strong></p> <h2>What Is Spot Rate?</h2> <p>The spot rate is the current <a href="/en/trading-academy/forex/what-affects-forex-exchange-rates/">exchange rate</a> for a particular digital or forex currency, commodity, or other financial instrument for settlement on the spot. In practice, this immediate settlement refers to the standard cycle in the spot market, typically at T+1 or T+2. The spot rate is also referred to as the "spot price”, but both terms are used for the same thing: the current value of an asset in its respective market.</p> <p><img alt="What is Spot Trading (ThinkMarkets)" src="/getmedia/d4f53196-4ef3-4897-82d9-d9e9653547cc/Academy-Forex-Spot-rates-How-Spot-Trades-Take-Place.png" /></p> <p style="text-align: center;">How Spot Trades Take Place</p> <p>The spot rate is used across many markets, but it’s the foundation of almost every transaction in currency markets. Market participants need foreign exchange currency rates for converting money, speculative spot rate trading in major currency pairs, or pricing derivatives.</p> <p>Here’s a closer look at the FX spot rate and what it means.</p> <h3>FX Spot Rate Definition</h3> <p>The FX spot rate is the current market price at which a particular currency can be bought or sold for immediate delivery. It shows the exchange rate between two currencies in the forex market, which is not the same as the forward rate. In the <a href="/en/trading-academy/commodities/what-are-commodities/">commodities market</a>, it also shows the current spot price for immediate purchase, which is priced in dollars or another currency. Forex spot trading provides a live exchange rate and can affect how traders make decisions.</p> <h3>Spot Rate Currency Example: EURUSD Exchange Rate</h3> <p>For example, the <a href="/en/eur-usd/">EURUSD forex pair</a> has a spot exchange rate of 1.1050, which means that you can exchange one euro for 1.1050 dollars right away. The forex spot price clearly shows what the current market price is for the EURUSD currency pair, which enables spot trading.</p> <p><img alt="Euro Rate Today (ThinkMarkets)" src="/getmedia/81ec20a5-9244-4b39-9273-1268ade6ec78/Academy-Forex-Spot-rates-EURUSD-Forex-Rate-Shown-on-ThinkMarkets-Web-Terminal.png" /></p> <p style="text-align: center;">EURUSD Forex Rate Shown on ThinkMarkets Web Terminal</p> <p>The forex spot rate is still the best price of a currency pair at a given moment. When a spot currency pair like the EUR/USD spot exchange rate is observed long enough, the quote will not stay the same as prices fluctuate regularly. Real-time supply and demand mainly drive these changes, along with other factors.</p> <p>For traders, it's essential to understand the fundamental drivers behind spot rate prices and what causes these changes in real time, as these price changes can affect trader performance.</p> <p><strong>Want to utilise on fundamental analysis? Check out our guide on <a href="/en/trading-academy/forex/fundamental-analysis-definition-drivers-and-trading-methodology/">Forex Fundamental Analysis</a>!</strong></p> <h2>How is Spot Price Determined in Commodity and Forex Markets</h2> <p>The spot price is determined by the interaction of the <a href="/en/trading-academy/forex/bid-ask-spread/">bid (buy) and ask (sell) prices</a>. There is no single universal spot rate formula, but a common approach is to calculate the mid-price between the bid and ask: (Bid + Ask) ÷ 2. The ask price is the lowest a seller is willing to accept, and the bid price is the highest price a buyer is willing to pay. The difference between these prices is called the spread.</p> <p><img alt="FX Exchange Rate Today (ThinkMarkets)" src="/getmedia/6eb6af48-40e2-48ec-85b4-5df1a16adfa2/Academy-Forex-Spot-rates-How-Spot-Price-is-Determined-Bid-and-Ask.png" /></p> <p style="text-align: center;">How Spot Price is Determined (Bid and Ask)</p> <p>The spot rate typically hovers between the bid and ask. Liquidity providers and market makers set these prices in real-time based on market conditions. Real-time spot rate changes might result from:</p> <ul> <li><a href="/en/trading-academy/indicators-and-patterns/what-are-forex-economic-indicators-and-how-they-impact-forex/">Economic releases</a> (e.g., CPI, NFP)</li> <li>Interest rate expectations</li> <li>Geopolitical events (wars, trade sanctions)</li> <li>Supply disruptions (oil supplies, wheat, etc.)</li> </ul> <p>These factors shape market value and drive fluctuations in spot prices, as well as help traders to anticipate changes and revamp their trading strategies. However, it is challenging to understand the full picture of price-making unless spot rates are distinguished from other instruments that are designed for different purposes.</p> <h2>Spot Exchange Rate vs Forward Rate vs Futures Prices vs CFDs</h2> <p>The spot exchange market rate, forward rate, and CFDs all represent different methods for trading currencies, commodities, cryptocurrencies and any other instruments. The spot rate shows the current market price, the forward rate is an exchange rate set today for a transaction that will occur at a specified date in the future, and CFDs are derivative instruments that allow traders to speculate on price movements without having to own the underlying asset.</p> <p>Futures prices are agreed-upon prices for delivery at a future date and often include interest rates, storage costs, or seasonal expectations. For example, if gold trades at a spot rate of $3,350/oz, a 3-month futures price might be $3,380 due to carry costs.</p> <p>CFDs are financial contracts based on the difference between the entry and exit price of an asset. Using leverage and the possibility to go both long and short are possible, but investing in CFDs also comes with overnight fees and other types of risks.</p> <p><img alt="Spot vs CFDs (ThinkMarkets)" src="/getmedia/703872cc-a5b9-4800-ba19-39ba2e6510cb/Academy-Forex-Spot-rates-table-image.png" /></p> <p style="text-align: center;">Spot vs Forward vs CFD Trading Comparison (ThinkMarkets)</p> <p>Let’s consider an example. If Brent Crude trades at a spot rate of $55 and a 3-month futures contract is priced at $57, the $2 difference in spot vs futures market price reflects storage and time value. A trader looking to buy Brent crude oil in July would use the $55 spot rate that determines the price for delivery within two business days. However, if the same trader anticipates buying Brent in November, since prices are often higher in this period of the year, it may be more cost-effective to enter into a $57 futures contract today.</p> <p><img alt="Brent Spot Market vs Futures Market (ThinkMarkets)" src="/getmedia/dfe87178-33c8-4a74-ab6c-467d58a6875a/Academy-Forex-Spot-rates-Spot-vs-Forwards-Price-Brent-Crude-Oil-Example.png" /></p> <p style="text-align: center;">Spot vs Forwards Price, Brent Crude Oil Example</p> <p>It's important to understand these distinctions, as each instrument carries different implications for cost, exposure, and strategy. Spot trading isn’t all advantages. It has its flaws.</p> <p><strong>Looking to trade Brent CFDs? <a href="https://portal.thinkmarkets.com/account/individual/" target="_blank">Try ThinkMarkets</a> and access up to 4,000 assets!</strong></p> <h2>Pros and Cons of Spot Trading</h2> <p>Spot trading offers a low barrier to entry for beginners into financial markets and forex trading. However, all trading involves risks. Spot trading still enables price discovery, improves market liquidity, opens up trading opportunities, and gives traders a chance to manage risk. However, like any trading instrument, it comes with some limitations that must be considered. Let’s take a look at both pros and cons of spot trading.</p> <h3>Pros of Spot Trading:</h3> <ul> <li><strong>Spot Execution:</strong> Spot rate trading for beginners is the easiest form of market participation as it is executed “on the spot” at current market prices. Leverage, expiry dates, and additional costs that require active management and better market knowledge are not present in the spot market.</li> <li><strong>Less Risky:</strong> There is no leverage in spot markets, so spot trading removes the amplification of risk that leveraged products have. But all trading involves high risk.</li> <li><strong>Lower Costs:</strong> Spot rate trading has lower transaction costs compared to other methods of accessing trading because of tighter spreads and lower fees.</li> <li><strong>Faster Execution:</strong> Forex pairs such as EUR/USD and commodities like gold offer deep liquidity in spot markets, facilitating faster execution.</li> <li><strong>Direct Ownership:</strong> Spot trading means you directly own the underlying asset. The gains and losses depend on real price changes of the actual asset.</li> </ul> <h3>Cons of Spot Trading:</h3> <ul> <li><strong>Limited Profit Potential in Falling Markets:</strong> There are fewer profit opportunities in falling markets because spot trading doesn’t support short selling.</li> <li><strong>No Leverage:</strong> Traders looking for higher returns with less capital will find spot markets restrictive, as leverage is not available.</li> <li><strong>Trading Hour Constraints:</strong> Spot markets have defined trading hours, which limit flexibility and liquidity during off-peak times.</li> </ul> <p><img alt="Forex Spot Trading (ThinkMarkets)" src="/getmedia/74bb8fe6-9c9b-43b8-9b11-67aebc3ddaaa/Academy-Forex-Spot-rates-Spot-Trading-Pros-and-Cons.png" /></p> <p style="text-align: center;">Spot Trading Pros and Cons</p> <p>Understanding the strengths and limitations of spot trading helps frame why the spot rate itself carries such importance. The choice of what instrument to trade should align with the trader's style.</p> <h2>Which Traders Benefit Most from Spot Trading</h2> <p>Different types of traders may be interested in trading spot.</p> <p><strong>The day trader</strong> focuses on multiple intraday trades, rarely holding positions overnight. Day traders use spot markets for their liquidity and tight spreads, targeting 10-20 pip movements on major forex pairs during high-volume hours (European/US session overlap with strict stop-losses). Immediate execution in liquid markets allows for quick entry/exit without overnight exposure risk.</p> <p><strong>Swing traders</strong> may also spot trade, holding positions for 3-5 days to capture larger market moves but focus on daily and weekly timeframes. Direct exposure to the asset without overnight fees that would accumulate with CFDs.</p> <p><strong>The long-term position trader</strong> focuses on wealth accumulation over months or years, owning an inflation hedge without the ongoing costs or expiration dates of derivatives.</p> <p>Finally, <strong>institutional traders</strong> like banks or funds managing large capital positions may use spot markets for currency conversion, asset procurement, or risk management. These large block trades in spot markets, often with algorithmic execution to minimise market impact, provide necessary liquidity than a single large trade would allow.</p> <p>But spot trading can be utilised for different reasons between <a href="/en/trading-academy/technical-analysis/method-to-analyse/">trader types</a> based on their objectives and situation.</p> <h2>Why Spot Rates Matter for Traders</h2> <p>Spot rates matter for traders looking for direct exposure to an underlying asset without the use of arbitrage. This method appeals to traders who like the simplicity of direct pricing.</p> <p>Traders, investors, and other market participants rely on the spot rate for trading because it:</p> <ul> <li>Shows the real-time price of an asset that market participants can use to compare or plan trades</li> <li>Helps set the base price for other products</li> <li>Makes it possible to trade quickly and at current market levels</li> <li>Allows market participants to protect themselves from price changes</li> </ul> <p>Types of traders who use spot rates may include:</p> <p><strong>Traders with lower risk tolerance</strong> - When trading on the spot, no leverage is used, and returns are based solely on the movement of the asset’s actual price. Traders with lower risk tolerance may prefer spot rates.</p> <p><strong>Traders recovering from past losses</strong> - Those who have experienced losses from leveraged products or unexpected margin calls may move to spot markets to regain control with a lower-risk strategy.</p> <p><strong>Traders with long-term holding strategies</strong> - Investors who prefer to hold assets without having to rebalance them regularly may find the spot market better aligned with their goals.</p> <p><strong>Traders who like simple mechanics</strong> - There are no hidden margin calls or expiry dates when trading on the spot market. Traders with a preference for simple mechanics may find spot trading easier to follow and manage.</p> <p><strong>Institutional players for conversions and procurement</strong> - Banks, corporates, and asset managers use spot rates as a reference for currency exchange, commodity rates, or real-time <a href="/en/trading-academy/indicators-and-patterns/what-are-forex-economic-indicators-and-how-they-impact-forex/">macro plays</a>.</p> <p>By understanding the different approaches to spot trading the markets, traders can align their strategies with their risk tolerance, time commitment, and financial goals while still capitalising on potential opportunities.</p> <h2>How to Spot Trade on ThinkTrader - Step by Step</h2> <p>Spot trading should be straightforward, and ThinkMarkets provides the best tools for fast and clear execution. Here’s how spot trading works on ThinkTrader:</p> <h3>Step 1. Locate Spot Price on ThinkTrader</h3> <p>Every trade should start trading with accurate, real-time price data. On <a href="https://web.thinktrader.com/account/login" target="_blank">ThinkTrader</a>, traders can access live spot rates for all forex pairs, cryptocurrencies, global indices, precious metals, and energies. They can track changes in bid/ask prices using the Market Watch panel or straight from the interactive currency charts, which show real-time tick-by-tick data.</p> <p><img alt="Spot Price Real-time Data (ThinkMarkets)" src="/getmedia/f2a172ff-bec2-4ae8-92b6-de2ef223a04e/Academy-Forex-Spot-rates-ThinkTrader-Real-time-Spot-Price-Data.png" /></p> <p style="text-align: center;">ThinkTrader Real-time Spot Price Data</p> <h3>Step 2. Understand Why Markets Are Moving</h3> <p>Before getting started, it’s essential to understand the reason behind the current pricing. ThinkTrader integrates a <a href="/en/trading-academy/market-events/how-to-use-the-thinkmarkets-economic-calendar/">live economic calendar</a> and real-time news feed to understand the reasons behind price movements. Traders can view event importance levels, filter by currency or events, and see <a href="/en/trading-academy/market-events/">real-time updates</a> as data is released. This is a practical way to understand why a market is reacting the way it is and helps with timing entries or avoiding volatile periods altogether.</p> <h3>Step 3. Pick the Spot Market to Buy</h3> <p>After conducting the market analysis, the next step is to select the right asset. ThinkMarkets offers access to 4,000 spot instruments, including major and minor forex pairs, as well as trading in commodities spot prices like gold, silver, <a href="/en/crude-oil-wti/">oil</a>, and <a href="/en/ngas/">natural gas</a>. Choosing the right one requires careful analysis of fundamentals and technical indicators.</p> <h3>Step 4. Time Trades and Set Stops</h3> <p>Entry timing is just as critical as picking the spot market. In the spot market, shorter timeframes like the 1-hour usually refine entries of day traders looking for confirmation signals such as breakouts or reversals. Stop-loss and take-profit levels must be determined well in advance based on your risk profile. ThinkTrader allows traders to set and adjust these levels directly from the chart.</p> <p><img alt="Spot Trading SL and TP Placement (ThinkMarkets)" src="/getmedia/38855c0b-e627-44d7-ad51-6f4a1a3a0a55/Academy-Forex-Spot-rates-Setting-Stop-loss-and-Take-Profit-in-Spot-Trading.png" /></p> <p style="text-align: center;">Setting Stop-Loss and Take-Profit in Spot Trading</p> <h3>Step 5. Execute CFD Trade and Monitor</h3> <p>Once the trade setup is finalised, execution is one click away. You can place the CFD order, monitor open positions through ThinkTrader’s dashboard, and receive instant feedback on performance. It is important to be prepared to adjust the strategy according to trading signals. Trailing stops, alerts, and position sizing calculators are also helpful to help manage risk exposure.</p> <p><img alt="Spot Trade Execution of EURUSD (ThinkMarkets)" src="/getmedia/cd2c22f2-1973-48d9-a1d9-e6ff60b3b521/Academy-Forex-Spot-rates-EURUSD-Spot-Trade-Execution-Example.png" /></p> <p style="text-align: center;">EURUSD Spot Trade Execution Example</p> <p><strong>Know How Spot Trading Works? <a href="https://portal.thinktrader.com/account/individual?lang=en" target="_blank">Try CFD Trading</a> on ThinkTrader!</strong></p> <h2>Spot Trading Risks and Considerations</h2> <p>Despite some benefits of spot trading, this method is also associated with some risks.</p> <p>Price volatility is one of the biggest challenges for traders. Spot prices can be highly volatile in reaction to news, economic data, or geopolitical shocks. These moves are rapid and may lead to sharp profit/loss swings in a matter of minutes.</p> <p>Another common pitfall is confusing spot markets with other instruments like <a href="/en/trading-academy/futures/what-is-futures-trading/">futures</a>. This may lead to unexpected outcomes for traders. In spot trades, the delivery is guaranteed. However, with CFDs, there is no direct asset ownership. But CFD trading involves leverage, overnight funding, and counterparty risk, with the settlement occurring virtually with cash.</p> <p>Most of these risks can be avoided with some preparation. Traders can choose optimal entry and exit points through <a href="/en/trading-academy/technical-analysis/definition-charts-and-strategy-method/">technical analysis</a> and understand the underlying factors behind price fluctuations, thanks to <a href="/en/trading-academy/forex/fundamental-analysis-definition-drivers-and-trading-methodology/">fundamental analysis</a>. To reduce the impact of volatility, it may be wise to pause opening positions during major economic releases or geopolitical events.</p> <p>Lastly, trading instruments should be studied thoroughly. Learning about the different instruments and their contract terms, settlement methods, and risk profiles will help traders prevent costly mistakes. Reading product specs and using demo accounts before live trading is a smart way to build that knowledge.</p> <div> <style type="text/css">.didyouknow { display: block; background: #F1FDf0; width: 600px; border-radius: 20px; gap: 20px; padding-top: 48px; padding-right: 40px; padding-bottom: 48px; padding-left: 40px; font-family: Figtree; font-weight: 600; font-size: 22px; line-height: 140%; letter-spacing: 0%; } </style> </div> <div style="text-align: center;"> <style type="text/css">.btn { font: Figtree; justify-content: center; align-items: center; text-align: center; gap: 7px; font-style: normal; font-size: 18px; line-height: 24px; padding: 13px 20px; border: 1px solid #ddd; border-radius: 38px; background: #5EE15A; } </style> </div> <div class="didyouknow">Not ready to trade live yet?<br /> <br /> <a class="btn" href="https://portal.thinkmarkets.com/account/individual/demo" style="text-decoration: none; font-weight: 500; color: #000000; background: 5EE15A;" target="_blank">Open a Demo Account!</a></div> <p> </p>

Why Forex Expert Advisors Fail And How to Build One The Right Way
<p>The nature of the forex market and the large selection of currency pairs may offer several opportunities for trading. But it also introduces several challenges for traders who rely solely on manual forex trading. This is where forex Expert Advisors (EAs) come into play.</p> <p>Expert advisors for forex automate trading strategies without human intervention, just by pre-programming some trading rules into them. They remove emotion from trading decisions, can improve efficiency, and save time and money for traders. However, a 2022 study at Southwest Jiaotong University shows that only 93.2% of free forex expert advisors fail in live markets.</p> <p>EAs in forex mainly fail due to the flawed process used to develop and backtest them. Most traders rush to code and optimisation without validation, use poor-quality data for forex backtesting, or fail to account for real trading conditions. This is where Traders Gym can help.</p> <p>By using Traders Gym, traders can validate forex strategies, filter out bad trades, and refine their approach before writing a single line of code.</p> <p>In this article, we present a fundamentally different approach. We explore:</p> <ul> <li>The purpose and benefits of forex EAs</li> <li>Common reasons why EAs fail in live trading</li> <li>The challenges traders face with EAs and how to overcome them</li> <li>How tools like Traders Gym can enhance the EA development process</li> <li>A step-by-step guide to creating and automating effective trading strategies</li> </ul> <p>Whether you are a beginner looking into automated trading or a trader using forex expert advisors and looking to refine your strategy, read along for insights into forex EA trading automation.</p> <p><strong>Get free access to Traders Gym <a href="https://web.thinktrader.com/account/login" target="_blank">here</a>!</strong></p> <h2>What are forex expert advisors</h2> <p>Forex Expert Advisors, also known as forex robots, are MetaQuotes software programmes designed to automate <a href="/en/trading-academy/forex/popular-forex-trading-strategies/">trading strategies</a> on MetaTrader 4 (MT4) and MetaTrader 5 (MT5) trading platforms. The primary purpose of these <a href="/en/trading-academy/forex/what-is-forex-trading/">forex trading</a> bots is to remove emotion from trading and enable 24/5 algorithmic trading across different time zones and market conditions.</p> <p>EA forex bots are used to analyse price action, <a href="/en/trading-academy/indicators-and-patterns/technical-indicators-beginners-guide/">technical indicators</a> and other predefined parameters and match them in the EA’s code to automate or semi-automate forex trading. Automated EAs work by following pre-programmed rules written in the MetaQuotes Language (MQL) programming language.</p> <p>To execute <a href="/en/trading-academy/forex/order-types/">buy or sell orders</a> without manual intervention on a forex pair, traders add an MT4 expert advisor or an MT5 expert advisor on the MetaTrader charts and “allow algo trading”.</p> <p><img alt="EA Metatrader (ThinkMarkets)" src="/getmedia/f61e1bda-1a81-4ec2-ab7e-2390eae28cd7/Academy-Forex-Expert-Advisor-Zig-Zag-Trend-Continuation-Short-Trade-with-MACD-Confirmation-GBPUSD-1D-Chart-1.png" /></p> <p style="text-align: center;">MT5 EA Activation on Chart</p> <p>The main objectives of forex EAs are:</p> <ul> <li><strong>Automation:</strong> EAs enable traders to automate trading strategies in the currency market, reducing manual trading and monitoring</li> <li><strong>Emotional Detachment:</strong> By removing human intervention, forex EAs help avoid impulsive trading decisions arising from fear or greed</li> <li><strong>Efficiency:</strong> EAs can quickly analyse a large amount of market data, identify trade opportunities and execute them with high speed and accuracy</li> <li><strong>Risk Management:</strong> Most EAs incorporate <a href="/en/trading-academy/cfds/risk-management-tools-in-cfd-trading/">risk management controls</a>, such as stop-losses and trailing stops, to effectively manage potential losses</li> <li><strong>Time Saving:</strong> Automation frees up time for traders, allowing them to focus on other tasks or learning new strategies</li> </ul> <p>The objectives can help traders stay consistent and disciplined in the long term. However, the effectiveness of a forex EA depends on several factors, some good and some bad.</p> <h2>Benefits and limitations of forex EAs</h2> <p>Forex EAs enable traders to automate trades, remove emotions and save time. However, they come with limits. Let’s look at the key benefits and limitations of Forex EAs.</p> <p><img alt="Metatrader Bot Pros and Cons (ThinkMarkets)" src="/getmedia/3177d4aa-6492-4063-86a4-5ec5f17c563e/Academy-Forex-Expert-Advisor-Zig-Zag-Trend-Continuation-Short-Trade-with-MACD-Confirmation-GBPUSD-1D-Chart-2.png" /></p> <p style="text-align: center;">MetaTrader EA Benefits and Limitations</p> <p>MetaTrader expert advisors offer numerous benefits, but some of their limitations can impact their effectiveness and lead to failure in live markets.</p> <h2>Why most forex EAs fail in live trading</h2> <p>While MT4 backtesting often shows promising results, many forex EAs fail to live up to expectations in live markets due to the way they are developed, tested and deployed. Below are some common reasons why EAs fail and how traders can address them.</p> <p><img alt="EA Failure Rate (ThinkMarkets)" src="/getmedia/b0e75ca7-70a0-4d15-a84c-4b7c461b4527/Academy-Forex-Expert-Advisor-Zig-Zag-Trend-Continuation-Short-Trade-with-MACD-Confirmation-GBPUSD-1D-Chart-3.png" /></p> <p style="text-align: center;">Reasons Forex EAs Fail in Live Trading</p> <h3>1. Rushing from strategy to coding</h3> <p>One of the biggest mistakes traders make is rushing from strategy to code without proper validation based on the assumption that their strategy will work because it <a href="/en/demo-account/">performed on paper</a>. However, this often leads to coding incomplete or unproven logic, resulting in an EA that fails in live markets.</p> <p>Professional EA development is also a costly process, and skipping validation will only increase the risk of wasting time and money. Before jumping into coding, traders must ensure their strategy has been thoroughly tested and refined.</p> <h3>2. Time-consuming manual testing</h3> <p>Manual validation of a strategy can be a painstaking process that requires weeks of analysing trading forex ideas on charts. This process makes many traders want to skip testing altogether or rush through it, which results in incomplete or unsuitable strategies for live trading.</p> <h3>3. Inadequate testing across market conditions</h3> <p>Many traders overlook testing their strategies across different market conditions. Volatility spikes caused by news events, low liquidity during off-market hours or weekends and sudden market gaps can all disrupt trading logic.</p> <p>Ignoring real market conditions like spreads and other charges can also distort results, especially for scalping or day trading strategies.</p> <h3>4. Limitations of MetaTrader MT4 and MT5</h3> <p>Most traders rely on <a href="/en/traders-gym/">free forex backtesting software</a> tools like MetaTrader’s Strategy Tester, which do not replicate live trading conditions. They fail to account for realistic spreads, slippage, liquidity, execution speed, emotional decision points and live trade management.</p> <h3>5. Insufficient understanding by the trader</h3> <p>Traders often lack a thorough understanding of forex EAs and how a rules-based strategy document needs to be set up for developers. Improper setup or emotional interference during the write-up can disrupt the EA’s logic and increase the risk of failure.</p> <p>Without proper testing and validation through a hybrid tool like Traders Gym, traders are likely to launch EAs that are ill-equipped to handle live trading conditions. Understanding why forex EAs fail is key to improving the success rate of automated trading systems.</p> <p><strong>Avoid developing an EA that won’t work. Start learning Traders Gym <a href="https://support.thinkmarkets.com/hc/en-gb/articles/19133134397713-What-is-Traders-Gym" target="_blank">now</a>!</strong></p> <h2>Main issues forex traders face with EAs</h2> <p>Most traders face issues with EAs due to the process from concept to coding, backtesting trading strategies, and final execution, and not because automated forex trading is inherently flawed. While this process is linear, it overlooks critical factors that can lead to poor performance in live trading. The main issues traders face are:</p> <ul> <li><strong>Backtest vs. Live Result Discrepancies:</strong> EAs cannot include variables like widening <a href="/en/trading-academy/forex/forex-spreads/">spreads and slippage</a>, are not backtested on accurate data and are over-optimised</li> <li><strong>Inability to Automate Subjective Strategies:</strong> EAs enable rule-based algo bot trading and cannot interpret complex price action, market sentiment, or discretionary decision-making</li> <li><strong>Lack of Forward Testing:</strong> Many traders skip forward testing, which involves running your EA in a live or demo environment to confirm it works as it was supposed to</li> <li><strong>Technical and Platform Issues:</strong> EAs are <a href="/en/trading-infrastructure/">highly dependent on technology</a>, and any technical glitches, like a system crash, can lead to losses</li> </ul> <p>Proper strategy testing is essential for forex traders to avoid these issues. And this begins way before a single line of code.</p> <h2>Why strategy testing is crucial before EA development</h2> <p>Strategy testing is a crucial stage in the development of a forex EA before investing time and money in building automations. It might look good initially, but it won’t withstand the test of time. Strategy testing is important to:</p> <ol> <li><strong>Validate if the strategy has a real edge</strong></li> <li><strong>Prevent automating noise or overfitted patterns</strong></li> <li><strong>Improve EA design by refining the logic</strong></li> <li><strong>Reduce emotional interference by building confidence</strong></li> </ol> <p><img alt="Forex EA Development (ThinkMarkets)" src="/getmedia/bf05fb90-b046-4ab1-b861-45dff97bd13c/Academy-Forex-Expert-Advisor-Zig-Zag-Trend-Continuation-Short-Trade-with-MACD-Confirmation-GBPUSD-1D-Chart-4.png" /></p> <p style="text-align: center;">Forex Trading Strategy Validation Cycle Before Development</p> <p>Let’s look into these points one by one.</p> <h3>1. Validate if the strategy has a real edge</h3> <p>Testing a forex strategy helps determine whether it has a genuine edge in the market. When analysing its performance across different market conditions, timeframes, and instruments, consistently positive results show whether the strategy is robust enough to handle market volatility and unexpected events.</p> <h3>2. Prevent automating noise or overfitted patterns</h3> <p>A big risk in EA development is automating strategies that are overfitted to historical data, which focuses on performing well on the dataset alone. However, these forex strategies fail to adapt to live market conditions. By testing a strategy, traders can filter out such noise and ensure that only adaptable strategies pass to EA development.</p> <h3>3. Improve EA design by refining the logic</h3> <p>Testing strategies before development allows traders to refine their strategy rules and logic. For example, it allows:</p> <ul> <li>Refine entry and exit rules to be clearer and objective</li> <li>Account for different market conditions, such as trending or ranging markets</li> <li>Define better risk management rules, such as <a href="/en/thinktrader/thinktrader-introduces-trailing-stop-loss-feature-for-advanced-risk-management/">stop-loss</a> and position sizing</li> <li>Improve the overall design of their EA and reduce the likelihood of development errors</li> </ul> <h3>4. Reduce emotional interference by building confidence</h3> <p>A well-tested strategy gives traders confidence in their forex system and helps them stick to their <a href="/getmedia/4c5adc0a-6378-4152-a838-b5e79edd7f16/10-tips-to-successful-trading-pdf.pdf">trading plan</a>. This reduces emotional interference, such as the temptation to override EA triggers or abandon it during drawdowns.</p> <p>Overall, the pre-development phase of expert advisors can help make better EAS in the development phase. It enables traders to invest a little time in testing and validation in return for:</p> <ul> <li>Avoid costly mistakes during EA development</li> <li>Ensure their strategy is robust and adaptable to real-world conditions</li> <li>Build a solid foundation for successful automation</li> </ul> <p>But to address the limitations of traditional processes, efficient strategy testing and refinement require bridging the gap between strategy development and automation.</p> <h2>Traders Gym: the missing link from strategy to code</h2> <p>Traders Gym is a free backtesting software tool that bridges the gap left by MetaTrader. It provides traders with a semi-automated forex simulator that uses previous live market conditions to help with the pre-development phase of EA development.</p> <p><img alt="Traders Gym ThinkMarkets Demo Account" src="/getmedia/6c051bb2-c816-4d14-9cf0-87eba603cc4e/Academy-Forex-Expert-Advisor-Zig-Zag-Trend-Continuation-Short-Trade-with-MACD-Confirmation-GBPUSD-1D-Chart-5.jpg" /></p> <p style="text-align: center;">Traders Gym ThinkMarkets Demo Account</p> <p>Traders Gym by ThinkMarkets</p> <p>The realistic simulations of Traders Gym ensure that traders can validate and refine their strategies objectively before investing in automation.</p> <h3>Key features of Traders Gym</h3> <p>Here’s how its features address the missing link between strategy and coding:</p> <ol> <li><strong>Realistic market replay:</strong> Traders Gym uses currency pair price data at traders’ pace, enabling them to fast-forward, pause, and replay scenarios multiple times and find edges to improve a strategy’s performance</li> <li><strong>Multiple assets and timeframes:</strong> With access to over 4,000 instruments, not just forex, Traders Gym enables traders to cross-check their strategies and adapt them</li> <li><strong>Realistic trading conditions:</strong> Traders Gym simulates real-world conditions, including spreads, providing an accurate representation of how a strategy would perform in live trading</li> <li><strong>Risk management testing:</strong> Traders Gym allows traders to set lot sizes, stop losses and take-profit levels to refine their strategies and enforce adherence to risk management</li> <li><strong>Integrated technical analysis:</strong> Traders can add technical indicators directly to the charts and test strategies to validate strategies that incorporate technical analysis</li> </ol> <p>Traders Gym provides a hybrid solution to strategy testing. While it addresses many of the limitations of MetaTrader, it also offers several other benefits.</p> <h3>Key benefits of Traders Gym</h3> <p>The features of Traders Gym translate into key benefits for backtesting and strategy validation. These are:</p> <p><strong>1. More reliable and efficient testing</strong></p> <p>Traders Gym is faster and more efficient than manual backtesting, while being more accurate and simpler than standard automated forex trading software. Its realistic simulations save time and provide reliable insights into a strategy’s performance.</p> <p><strong>2. Early detection of poor strategies</strong></p> <p>Traders Gym helps detect and filter out poor strategies early in the development process by letting traders perform them in realistic market conditions. This prevents wasting time and resources on strategies that are unlikely to succeed.</p> <p><strong>3. Accessible across devices</strong></p> <p>Available on both desktop and mobile via the ThinkTrader app, Traders Gym enables flexible backtesting 24/7, catering to traders who prefer working remotely or on the go.</p> <p><strong>4. Cost-effectiveness</strong></p> <p>Developing an EA can be expensive, especially if the strategy is poor. Validating strategies in Traders Gy leaves traders with more resources for the strategies that do work well.</p> <p>While thriving in realistic market conditions, Traders Gym cannot capture slippage costs and commissions when trading with real money. However, it still addresses MetaTrader limitations.</p> <p><strong>Start your EA development journey before you automate with <a href="https://web.thinktrader.com/account/login" target="_blank">Traders Gym</a>!</strong></p> <h2>MT4 & MT5 limitations vs. Traders Gym</h2> <p>MetaTrader offers a popular tool for automating trading strategies, the Strategy Tester. However, it comes with several limitations that can hinder the development of robust forex EAs. Here’s a detailed comparison of MT4 and MT5 with Traders Gym:</p> <p><img alt="Traders Gym, Free Backtesting Software Forex (ThinkMarkets)" src="/getmedia/b9b6f544-0e15-4fe0-ab69-ab13aabc499d/Academy-Forex-Expert-Advisor-Zig-Zag-Trend-Continuation-Short-Trade-with-MACD-Confirmation-GBPUSD-1D-Chart-7.png" /></p> <p style="text-align: center;">MetaTrader vs. Traders Gym Comparison</p> <p>MetaTrader is a powerful and widely used platform that is needed to fully automate forex Expert Advisors. But Traders Gym complements the process development, helping traders validate and refine strategies before committing to EA development or live trading.</p> <p><strong>Not familiar with forex backtesting on Traders Gym? Read the guide here!</strong></p> <h2>From strategy to EA forex trading (step-by-step)</h2> <p>Automating a forex trading strategy can be easy, but it requires a structured approach to succeed. Below is a step-by-step process that helps traders create and automate their strategies while minimising development risks.</p> <p><img alt="EA in Trading Forex (ThinkMarkets)" src="/getmedia/c391ab23-0c7f-467c-ae2d-344b40f5ef5b/Academy-Forex-Expert-Advisor-Zig-Zag-Trend-Continuation-Short-Trade-with-MACD-Confirmation-GBPUSD-1D-Chart-8.png" /></p> <p style="text-align: center;">Step-by-Step Process of EA Development</p> <h3>Step 1: Initial strategy development</h3> <p>The first step in forex automation is to create a well-defined trading strategy. A trader defines key aspects of their strategy, which include trading logic, risk management, and performance tracking. Ask yourself:</p> <ul> <li>Do I need a trend trading, reversal, or range trading strategy?</li> <li>What price action or indicator will I use?</li> </ul> <p>At this stage, it is important to set rules for entry, stop-loss and take-profit levels. However, it requires traders to journal trades to confirm whether the strategy is effective manually. Recording performance metrics, such as win rate, drawdown and risk-reward ratio, provides a solid foundation for automating a strategy.</p> <h3>Step 2: Traders Gym validation</h3> <p>Once a forex trading strategy is selected, traders need to validate it in a realistic environment. Unlike other backtesting tools, Traders Gym forex trading simulator allows market replay of historical data tick-by-tick, replicating trades as they would in live trading. Traders can:</p> <ul> <li>Test strategies across different market sessions and assets</li> <li>Adjust the replay speed to simulate emotions or analyse specific scenarios</li> <li>Identify edges, such as news spikes or false breakouts, that may affect the strategy</li> </ul> <p>The goal is to achieve consistency and control while identifying flaws to determine whether the strategy is ready for EA development or needs more refinement.</p> <h3>Step 3: Traders Gym refinement</h3> <p>Following the initial Trader Gym strategy test, the next step is to refine it by adjusting parameters such as entry signals, indicator settings, and exits, without overfitting.</p> <p>Traders can return to Traders Gym to test different settings and ask:</p> <ul> <li>Does adding a volume filter reduce false trade signals?</li> <li>Does increasing the <a href="/en/trading-academy/forex/simple-moving-averages/">moving average</a> period filter out bad signals?</li> <li>How does adjusting stop-losses and take-profits affect performance?</li> </ul> <p>The purpose of refinement is not only to increase the win rate but to improve the quality of execution, reduce drawdown, and attain consistency.</p> <h3>Step 4: Conversion of rules to programmatic document</h3> <p>After a secondary test and refinement on Traders Gym, the strategy must be converted into clear, objective rules that a developer and an expert advisor can follow. Many strategies fail in automation because they rely on intuition or discretion. To avoid this, traders may:</p> <ul> <li>Break down the logic into binary terms (e.g., "If X and Y occur, open a trade; if Z occurs, close the trade")</li> <li>Translate subjective elements, such as "strong support" or "strong resistance," into measurable criteria like <a href="/en/trading-academy/forex/using-candlestick-patterns-in-forex-day-trading/">candlestick patterns</a>, indicators, or price levels</li> </ul> <p>All these rules are the blueprint to guide the EA development process, and if a strategy cannot be fully described in logical statements, it is not ready for automation.</p> <h3>Step 5: Development of EA trading forex robot</h3> <p>With a refined strategy translated into adjustable inputs, the next step is to develop the EA trading forex robot in MQL4 or MQL5. If traders lack coding skills, the most likely scenario, hiring an EA expert and paying them is the way to go.</p> <p>It is important to remember that the EA will still not work perfectly and will require rigorous testing, adjusting of variables, and even re-coding if backtests show poor results.</p> <h3>Step 6: MT4/MT5 forex backtesting</h3> <p>Once the EA is fully developed, the next step is to perform a forex backtest using the MT4 or MT5 Strategy Tester. Backtesting should be ideally done on multiple currency pairs, different but nearby timeframes, and across several years of data, be it combined or segregated periods. Performance metrics like win rate, maximum drawdown, profit factor and net profit will reveal the odds of strategy success.</p> <p>Note that at this stage, the focus should be on evaluating the mechanical performance of the strategy and not on chasing perfect equity curves. If the results diverge significantly from the performance record during manual trading, traders should review the trading logic or the code itself.</p> <h3>Step 7: Forward forex testing</h3> <p>If the forex backtesting results do not diverge, the EA should be put through forward testing. This step involves running the EA on a small–sized live account with real prices and other conditions, to confirm the EA performs similarly to real-time conditions.</p> <p>Forward testing typically takes a few weeks to months, serving as the final validation step before deploying the EA in an appropriately-sized live account.</p> <h3>Step 8: Result comparison</h3> <p>After forward testing, the final stage is to compare the results of the three stages to determine whether the EA aligns with your trading goals:</p> <ul> <li>Traders Gym backtesting</li> <li>MT4 / MT5 backtesting</li> <li>Forward testing</li> </ul> <p>Performance metrics, such as drawdown, win rate, profit factor, and net gains, should align across all three stages with little variation. Significant discrepancies call for further investigation before risking real money on the strategy. Note that going live is not the end of this process.</p> <p>By combining tools like Traders Gym with rigorous backtesting and forward testing, traders can create reliable EAs that perform well in live markets.</p> <p><strong>Ready to build robust EAs? Open your account and start testing <a href="https://portal.thinkmarkets.com/account/individual/" target="_blank">risk-free</a>!</strong></p> <h2>Ready to build your trading robot with Traders Gym?</h2> <p>The journey from strategy to forex expert advisor is a challenging but rewarding process. But key to building a robust EA for live market conditions lies in proper testing, refinement, and validation at every stage.</p> <p>Popular tools like MetaTrader are good for automating strategies but fall short when it comes to realistic trading conditions and validation at the pre-development level. This is where Traders Gym stands out, a hybrid simulation environment with tick-by-tick data, realistic trade execution, and integrated technical indicators at any stage of the process.</p> <p>Traders Gym bridges the gap between strategy and EA development and empowers traders to:</p> <ul> <li>Validate strategies under real-world conditions</li> <li>Identify and filter out non-viable strategies early</li> <li>Save time and money by refining strategies before coding them into EAs</li> </ul> <p>If you want to start trading with more reliable EAs, incorporate Traders Gym into your process with a structured approach to strategy development. This may improve your chances of success in automated trading and elevate your trading experience overall.</p>
Forex Scalping: What is it, Optimal Trading Conditions & Strategies
<p>Forex scalping focuses on capturing quick profits from small fluctuations in currency prices. But it is a high-risk trading technique that rarely yields consistent profits.</p> <p>Unlike other types of trading methods, scalping in forex involves multiple trades per session to gain just a few pips per trade. This active trading type is more suitable for forex traders who have a liking for trading fast. Although it is relatively easy to employ technical analysis for scalping, it still requires a thorough understanding of price action and forex market liquidity to trade effectively.</p> <p>Besides a proper high-speed trading strategy, scalping forex needs intense focus, quick decision-making and sound risk management to execute effectively. More importantly, it demands FX scalping conditions that minimise transaction costs and execution risks.</p> <p>In his book, Scalping Trading: Top 5 Strategies, Andrew C. Ellis notes a high win-rate scalping strategy with an accuracy rate of over 80% under favourable conditions. When professional scalpers with a top short-term trading strategy discover the best platform for scalping, quick wins may be probable.</p> <p>Whether you are a beginner scalper thinking about how to forex scalp or a pro, this brief trading guide will go over:</p> <ul> <li>Fundamentals of this type of forex trading strategy</li> <li>Scalping tools and best indicators for scalping</li> <li>Optimal conditions and forex pairs for scalp trades</li> <li>Scalping strategies in forex to test in a demo environment</li> <li>Compulsory risk management principles for scalper traders</li> <li>Whether scalping on forex suits your trading style and mindset</li> </ul> <p>By the end, you should have a good understanding of scalping to decide whether scalp trading forex is right for you.</p> <div> <style type="text/css">.didyouknow { display: block; background: #F1FDf0; width: 600px; border-radius: 20px; gap: 20px; padding-top: 48px; padding-right: 40px; padding-bottom: 48px; padding-left: 40px; font-family: Figtree; font-weight: 600; font-size: 22px; line-height: 140%; letter-spacing: 0%; } </style> </div> <div class="didyouknow">Beginner in scalping? Practice risk-free with a ThinkMarkets <a href="https://portal.thinkmarkets.com/account/individual/demo" target="_blank">demo account</a>.</div> <h2>What is Scalping in Forex?</h2> <p>Scalping in <a href="/en/trading-academy/forex/what-is-forex-trading/">forex</a> is a high-speed type of trading where traders take several trades throughout a session, each completed within seconds or minutes. Scalping <a href="/en/trading-academy/forex/popular-forex-trading-strategies/">strategies</a> often utilise the 1-minute and 5-minute timeframes (TFs) to benefit from tiny price movements during periods of high liquidity. Only rarely do scalpers use the 15-minute TF.</p> <p><img alt="Scalp Trade (ThinkMarkets)" src="/getmedia/8844dbdf-7e37-4234-b268-f4fb1d2b768b/Academy-Forex-scalping-zig-zag-indicator-on-gbpusd-1d-chart-thinkmarkets-tradingview.png" /></p> <p style="text-align: center;">Scalp in Trading Returns Small Profits Quickly</p> <div style="text-align: center;"> </div> <p>By nature, forex scalping techniques share some similarities with high-frequency trading (HFT). However, they don't require heavily researched trading algorithms, rigorous backtesting or the infrastructure that institutions use. Instead, a scalping system relies on:</p> <ul> <li>Manual or semi-automated trading execution</li> <li>Decisions based on technical analysis</li> <li>Sound price action interpretation</li> <li>Quick market reading and action skills</li> </ul> <h3>Key Characteristics of Scalping in the Forex Market</h3> <ul> <li><strong>High Trade Volume:</strong> Multiple trades per session</li> <li><strong>Short Trade Duration:</strong> Exit strategy from seconds to minutes</li> <li><strong>High Liquidity:</strong> Active forex sessions with high liquidity</li> <li><strong>Low Risk Exposure:</strong> Controlled position sizes (typically 0.5-1% per trade)</li> <li><strong>Quality Execution:</strong> Fast execution and minimal trading costs</li> </ul> <p>Scalping is a style of trading that suits traders who prefer active trading and hands-on execution. It demands strict discipline and adherence to specific scalping rules and protocols compared to other trading styles.</p> <h2>How Scalping Differs From Other Forex Trading Styles</h2> <p>Scalping is the most active <a href="/en/trading-academy/technical-analysis/method-to-analyse/">trading style</a> among all trading approaches in FX markets. Certain characteristics set it apart from other forex trading methods.</p> <p><img alt="Scalping Trading Technique vs Other Methods (ThinkMarkets)" src="/getmedia/eb542385-90d1-4fe9-8596-3ca24c27076c/Academy-Forex-scalping-best-forex-indicators-for-trend-trading-thinkmarkets.png" /></p> <p style="text-align: center;">Scalping vs Day Trading vs Swing Trading vs Position Trading</p> <p>However, scalping does have its own distinct issues over other trading methods, despite some advantageous characteristics.</p> <h2>Pros and Cons of Scalping Forex</h2> <p>Scalping forex is a hands-on trading style that does not require complex analysis or long-term forecasting. However, it comes with distinct advantages and challenges that beginner scalpers should be aware of.</p> <p><img alt="Scalping in Trading Pros and Cons (ThinkMarkets)" src="/getmedia/6f347776-e272-4e47-8325-3d9adcb22aa2/Academy-Forex-scalping-best-forex-indicators-for-trend-trading-thinkmarkets-1.png" /></p> <p style="text-align: center;">Scalping in Trading Pros and Cons (ThinkMarkets)</p> <div> <style type="text/css">.didyouknow { display: block; background: #F1FDf0; width: 600px; border-radius: 20px; gap: 20px; padding-top: 48px; padding-right: 40px; padding-bottom: 48px; padding-left: 40px; font-family: Figtree; font-weight: 600; font-size: 22px; line-height: 140%; letter-spacing: 0%; } </style> </div> <div class="didyouknow">Moved by the advantages of Scalping? <a href="https://portal.thinkmarkets.com/account/individual/demo" target="_blank">Test</a> your mindset before committing real capital.</div> <h2>What Are The Best Forex Scalping Conditions</h2> <p>The success of forex scalping largely depends on market conditions. A scalping strategy in forex may be adaptable, but specific environments are more favourable than others. Generally, take into account:</p> <ul> <li><strong>Best Trading Windows:</strong> Which forex session is highly active or active enough</li> <li><strong>Most Effective Currency Pairs:</strong> The most liquid forex pairs to avoid increased spreads</li> <li><strong>Market Structure Requirements:</strong> Technicals that align with your scalping forex strategy</li> <li><strong>When to Avoid Scalping:</strong> Volatility environments to avoid due to slippage</li> </ul> <p><img alt="Best Conditions Live Trading Scalping (ThinkMarkets)" src="/getmedia/9795d3c9-41ac-469a-8745-206ad4725098/Academy-Forex-scalping-trend-reversal-turns-into-trend-continuation-gbpusd-1d-chart-1.png" /></p> <p style="text-align: center;">Best Conditions for Forex Scalping</p> <p>Let’s dive into each of these points.</p> <h3>Best Trading Windows</h3> <ul> <li><strong>London-New York overlap (13:00-17:00 GMT):</strong> Liquid periods allow for tighter spreads and the most predictable price action</li> <li><strong>Tokyo-London overlap (7:00-9:00 AM GMT):</strong> Offers secondary opportunities (best used for Asian pairs) with still sufficient liquidity</li> </ul> <h3>Most Effective Currency Pairs</h3> <ul> <li><strong>Major pairs:</strong> Major pairs like EUR/USD, GBP/USD and USD/JPY offer low spreads (0.1 to 0.3 pips) during high-activity times</li> <li><strong>Avoid exotic pairs:</strong> Higher volatility adds to spreads and reduces already strained profitability</li> </ul> <h3>Market Structure Requirements</h3> <ul> <li>Established supports and resistances</li> <li>Strong directional moves with gradual selloffs</li> <li>High-reliability chart patterns like the <a href="/en/trading-academy/technical-analysis/trading-cup-and-handle-patterns-in-forex-markets/">Cup and Handle</a></li> </ul> <h3>When to Avoid Scalping</h3> <ul> <li>Major economic data releases like the <a href="/en/trading-academy/technical-analysis/dead-cat-bounce-pattern-trading/">NFP</a> or interest rate decisions</li> <li>Transitions between forex sessions (actual open/close of markets)</li> <li>Friday afternoons, as trading cools off</li> <li>Periods of extreme volatility</li> </ul> <p>Traders who consider these conditions should be able to manage risk exposure more effectively, as well as improve the success of trading opportunities.</p> <h2>How to Start Scalping Trading in Forex</h2> <p>Scalping trading in forex requires specific setups and tools to start trading the short timeframes. To start scalping FX, use a systematic approach.</p> <p><img alt="How to Start Forex Scalping (ThinkMarkets)" src="/getmedia/83140256-cee1-49e3-8bf7-530502ff1be7/Academy-Forex-scalping-zigzag-steeper-angle-produces-more-gains-gbpusd-1d-chart-1.png" /></p> <p style="text-align: center;">How to Get Started with Forex Scalping</p> <h3>1. Configure Your Hardware</h3> <p>Forex scalping mandates reliable equipment:</p> <ul> <li>Top-shelf PC (avoid using processing power elsewhere when scalping)</li> <li>High-speed (fibre), independent internet connection, no interruptions</li> <li>Two (or three) desk monitors, one for charts, one for execution (one for tick volumes)</li> <li>SSD drive for faster data processing (install the desktop platform on the SSD)</li> </ul> <p>Any hardware limitations may lead to missed opportunities or delayed entries and exits, weighing on profits.</p> <h3>2. Choose The Right Forex Broker</h3> <p>For proper control over scalp orders, ThinkMarkets provides:</p> <ul> <li>One-click trading feature for instant long and short scalps</li> <li>Ultra-low latency execution and near-zero slippage</li> <li>Real-time price updates that minimise spreads</li> <li>Advanced charting capabilities with no scalping restrictions</li> <li>Stable ThinkMarkets or TradingView trading environment</li> </ul> <p><strong>Tip:</strong> Your choice of trading platform can impact execution quality and profitability. Even a millisecond delay can turn winning trades into losing ones.</p> <h3>3. Arrange Your Trading Charts</h3> <p>Set up your trading charts in a way that supports quick decision-making:</p> <ul> <li>Clean layout with just essential price action</li> <li>Clear candlestick colours with proper contrast</li> <li>Mark support and resistance zones ahead of time</li> <li>Consistent zoom level showing necessary context</li> <li>Avoid visual distractions</li> </ul> <p>Your charts should provide clarity. If you need to analyse what's happening, your setup needs to change.</p> <h3>4. Select Appropriate Scalping Indicators</h3> <p>Choose scalping indicators that support quick analysis:</p> <p><a href="/en/trading-academy/technical-analysis/trend-trading-indicators-for-forex/">Leading indicators</a> can signal trend changes before they occur:</p> <ul> <li><strong>RSI (14):</strong> Signals shifts in momentum before price follows</li> <li><strong>Stochastic Oscillator:</strong> Spots early trend reversal points in sideways markets</li> <li><strong>On-Balance Volume</strong>: Measures buying and selling pressure as price moves</li> </ul> <p>Lagging indicators can hint at potential trend reversals, confirm trends as well as measure volatility:</p> <ul> <li><strong>Exponential Moving Averages (EMAs):</strong> Confirm trend direction and duration</li> <li><strong>Bollinger Bands (BBs):</strong> Measure volatility and spot potential reversal zones</li> <li><strong>MACD:</strong> Identifies trend momentum shifts through moving average crosses</li> </ul> <p>One should select only technical indicators that provide clear signals for a distinct FX scalping strategy and timeframe. Some forex scalping indicators work better in certain conditions versus others.</p> <h3>5. Build an FX Scalping Strategy</h3> <p>Develop a simple scalping forex system:</p> <ul> <li>Simple scalping setups you can identify immediately</li> <li>Clear entry triggers based on specific trading signals</li> <li>Straightforward exit rules that require minimal decision-making</li> <li>Time-based exits for dumping poor trades, e.g., enter and exit at open and close</li> <li>Risk parameters adapted for short-term movements on liquid forex pairs</li> </ul> <p>The most effective FX scalping strategy isn't necessarily complex, but one you can execute confidently under pressure during fast market conditions.</p> <div> <style type="text/css">.didyouknow { display: block; background: #F1FDf0; width: 600px; border-radius: 20px; gap: 20px; padding-top: 48px; padding-right: 40px; padding-bottom: 48px; padding-left: 40px; font-family: Figtree; font-weight: 600; font-size: 22px; line-height: 140%; letter-spacing: 0%; } </style> </div> <div class="didyouknow">Trade with confidence - <a href="/en/trading-academy/forex/risk-management/">explore</a> our advanced risk management tools</div> <h2>Popular Forex Scalping Strategies to Test</h2> <p>When you learn scalping <a href="/en/forex-trading/">forex trading</a>, it is recommended to test even the best scalping strategy on a demo account before risking real capital. Here are five simple, one-indicator forex scalping strategies that require minimal setup and effort to test.</p> <h3>Price Action Scalping Strategy</h3> <p>Forex price action scalping strategies respond instantly to price changes without indicator lag. This simple scalping strategy utilises the 1-minute or 5-minute chart, with clearly defined support and resistance levels. Rules for an example price scalping strategy are:</p> <ul> <li><strong>Entry Rules:</strong> Enter when the price breaks from consolidation with clear momentum</li> <li><strong>Exit Rules:</strong> Exit near the next key level or when momentum stalls</li> <li><strong>Stop Loss:</strong> Place a stop loss just below the recent swing low/high</li> </ul> <p><img alt="Forex Price Action Scalping (ThinkMarkets)" src="/getmedia/ae5d5920-5e86-4416-bd08-d8ef5e30a70a/Academy-Forex-scalping-zigzag-rsi-reversal-long-trade-with-trend-confirmation-gbpusd-1d-chart-1.jpg" /></p> <p style="text-align: center;">Scalping Price Action, 1min Scalping Strategy (EURUSD)</p> <p>In the EURUSD scalping trading example above, the entry is at 1.18108 following a clean breakout from the range. The stop loss is set just below the recent low at 1.18052, and the exit near the next resistance level at approximately 1.18189.</p> <p><a href="/en/trading-academy/forex/using-candlestick-patterns-in-forex-day-trading/">Candlestick patterns</a> for scalping, such as the <a href="/en/trading-academy/technical-analysis/single-candlestick-patterns-a-guide-for-day-trading/">single-candle Marubozu formation</a>, often complement price action strategies well.</p> <h3>RSI Scalping Strategy Forex</h3> <p>A scalping forex strategy using the RSI filters scalp trades based on momentum strength. It can help FX scalpers to identify momentum shifts early without lag. Scalping EURUSD below uses the RSI 14-period on the 1-minute chart, with a focus on:</p> <ul> <li><strong>Entry Rules:</strong> <ul> <li>Enter long when RSI crosses above 50 during upward price movement</li> <li>Enter short when RSI crosses below 50 during a downward movement</li> </ul> </li> <li><strong>Exit Rules:</strong> Exit when RSI approaches overbought/oversold (70/30) zones</li> <li><strong>Stop Loss:</strong> Below recent swing low for longs or above recent swing high for shorts</li> </ul> <p><img alt="RSI Setting for Scalping (ThinkMarkets)" src="/getmedia/19a640d2-ab0b-4036-9592-f9bceedc7f35/Academy-Forex-scalping-zig-zag-trend-continuation-short-trade-with-macd-confirmation-gbpusd-1d-chart-1.jpg" /></p> <p style="text-align: center;">RSI for Scalping, 1-minute Scalping Strategy (EURUSD)</p> <p>Simply adding the RSI to the previous one-minute scalping strategy example, one can notice a momentum break above the 50 RSI line as the price exits the consolidation area. A potential long entry is at 1.18108 and a stop loss just below 1.18052, which aligns with RSI approaching the overbought 70 level.</p> <h3>EMA Scalping Strategy Forex</h3> <p>Despite the lag, the EMA cross strategy can filter out noise and enable forex scalpers to catch directional moves. Due to this lag, this 9-EMA scalping strategy, which involves a crossover of the 21-EMA, uses the 5-minute chart. To test it, follow the scalping rules below:</p> <ul> <li><strong>Entry Rules:</strong> <ul> <li>Enter long when fast EMA crosses above slow EMA</li> <li>Enter short when fast EMA crosses below slow EMA</li> </ul> </li> <li><strong>Exit Rules:</strong> Exit when EMAs begin to flatten or reverse</li> <li><strong>Stop Loss:</strong> Above most recent swing high for shorts or below recent swing low for longs</li> </ul> <p><img alt="Best EMA for Scalping (ThinkMarkets)" src="/getmedia/d4fcf022-690f-44d5-b09d-2e82dde118a6/Academy-Forex-scalping-zig-zag-trend-continuation-short-trade-with-macd-confirmation-gbpusd-1d-chart-2.jpg" /></p> <p style="text-align: center;">9-21 EMA for Scalping, 5-minute Scalping Strategy (EURUSD)</p> <p>In the EUR/USD 5-minute scalping example above, a bearish crossover appears near 1.18033 shortly after the price stalls at a local high. A stop loss is placed above the most recent swing high at 1.18103, and the take profit level extends down to the previous support zone around 1.17907.</p> <p><strong>Tip:</strong> FX scalping strategies using lagging indicators can be supported by trading volume indicators</p> <h3>Bollinger Band Scalping Strategy: Mean Reversion</h3> <p>Bollinger Bands help identify overextension in price, allowing forex scalpers to utilise band rejections and mean-reversion setups. The Bollinger Bands scalping strategy involves using the 20-period Bollinger Bands, either at 2 or 1.5 to 2 standard deviations on the 5-minute chart. The rules say:</p> <ul> <li><strong>Entry Rules:</strong> Enter when price pierces a band, then shows reversal signals</li> <li><strong>Exit Rules:</strong> Target the middle band for take-profit</li> <li><strong>Stop Loss:</strong> Use tight stops beyond recent swing points</li> </ul> <p><img alt="Bollinger Bands Settings for Scalping (ThinkMarkets)" src="/getmedia/85e0147f-862a-4c96-9d8d-68ace4954c07/Academy-Forex-Scalping-zig-zag-trend-continuation-short-trade-with-macd-confirmation-gbpusd-1d-chart-3.jpg" /></p> <p style="text-align: center;">Bollinger Bands Scalp, 5-minutes Scalping Strategy (EURUSD)</p> <p>In the above EUR/USD scalping example, the price breaks above the upper band and pulls back to the mean, marking a quick scalp long at 1.17989. The stop-loss is placed below the swing low at 1.17898, with an exit near the top of the move as the price closes firmly near 1.18188.</p> <p><strong>Tip:</strong> Mean reversions are assumed to increase the odds that a scalp trade may continue towards the direction of the prevailing trend.</p> <h3>Stochastic Scalping Strategy Forex</h3> <p>The Stochastic responds quickly to momentum shifts, ideal for scalping in and out at extreme levels. It uses momentum exhaustion as entry or exit points. The Stochastic scalping strategy is set at %K:14 and %D:3 on the 1-minute or 5-minute chart. Forex scalper traders can:</p> <ul> <li><strong>Entry Rules:</strong> <ul> <li>Enter longs when %K crosses above %D below the 20 line</li> <li>Enter shorts when %K crosses below %D above the 80 line</li> </ul> </li> <li><strong>Exit Rules:</strong> Exit as the oscillator approaches the opposite extreme</li> <li><strong>Stop Loss:</strong> Above recent high for shorts or below recent low for longs</li> </ul> <p><img alt="Stochastic Settings for Scalping (ThinkMarkets)" src="/getmedia/87f72eda-7a54-401d-b034-42f02b6772cc/Academy-Forex-scalping-zig-zag-trend-continuation-short-trade-with-macd-confirmation-gbpusd-1d-chart-5.jpg" /></p> <p style="text-align: center;">Stochastic Scalping, 5-minutes Scalping Strategy (EURUSD)</p> <p>In the strategy example above, the %K line crosses below the %D line in the overbought region, signalling a short entry at 1.18036. A tight stop loss is placed above the recent high at 1.18059, with an exit triggered when the Stochastic is oversold and another cross occurs.</p> <p>Of course, scalping strategies in forex require discipline, precise execution, and strict risk management.</p> <div> <style type="text/css">.didyouknow { display: block; background: #F1FDf0; width: 600px; border-radius: 20px; gap: 20px; padding-top: 48px; padding-right: 40px; padding-bottom: 48px; padding-left: 40px; font-family: Figtree; font-weight: 600; font-size: 22px; line-height: 140%; letter-spacing: 0%; } </style> </div> <div class="didyouknow"><a href="https://portal.thinkmarkets.com/account/individual/demo">Test</a> your scalping strategy with a broker offering ultra-fast execution</div> <h2>Scalping Risk Management: Step-by-Step Process</h2> <p>Forex scalping requires rapid trading, entry and exit precision, and a disciplined approach to risk management. Follow the 6-step process below to manage scalping risks and your capital more effectively.</p> <h3>Step 1: Pre-Trade Checks</h3> <ul> <li>Trade during highly liquid sessions and forex pairs</li> <li>Monitor ATR values to gauge pre-trading volatility</li> <li>Check FX spreads before entering scalp trades</li> <li>Avoid news-heavy events unless specifically planning for volatility</li> </ul> <h3>Step 2: Define Scalp Trade Risk</h3> <ul> <li>Limit per trade risk to 0.5% to 1% of the trading account <ul> <li>Calculate position size using: Account size × risk percentage ÷ stop distance in pips</li> <li><strong>Example:</strong> On $10,000 with 0.5% risk and a 10 pip stop, the position size would be 0.5 mini lots</li> </ul> </li> <li>Reduce risk during unexpected circumstances or when testing new setups</li> </ul> <h3>Step 3: Set Scalping Stop Losses and Targets</h3> <ul> <li>Stop-losses typically range between 5 and 10 pips for liquid pairs</li> <li>Consider wider stops (up to 15 pips) for more volatile pairs</li> <li>Many scalper traders set stops at 1-1.5 x ATR to account for normal market volatility</li> <li>Target 5-20 pip moves for take profit</li> <li>Consider trailing stops after 5+ pip profit</li> </ul> <h3>Step 4: Scale In or Out of Scalp Trades Properly</h3> <ul> <li>Use appropriate leverage as it amplifies losses</li> <li>Consider scaling in gradually for strong setups</li> <li>Consider scaling out quickly when a scalp trade goes wrong</li> <li>Avoid taking multiple trades when on a tighter margin</li> </ul> <h3>Step 5: Manage Drawdowns and Losing Streaks</h3> <ul> <li>Reduce position size by half after three consecutive losses</li> <li>Take a break after three or more losses in a trading session</li> <li>Temporarily switch to demo if daily drawdown exceeds 3%</li> <li>Reassess strategy if weekly drawdown exceeds 5% of account value</li> <li>Review the trading journal before resuming after hitting loss limits</li> </ul> <p>Tip: ThinkMarkets provides negative balance protection in a multi-regulated environment</p> <h3>Step 6: Maintain Trader Discipline</h3> <ul> <li>Establish firm daily loss limits (e.g., 3% of account value)</li> <li>Combat overconfidence after winning streaks</li> <li>Use a pre-trade checklist to ensure the emotional state doesn't override the trading plan</li> <li>Take short breaks every 60-90 minutes to maintain decision quality</li> <li>Maintain a trade journal for objective performance assessment</li> </ul> <p>The best scalping forex systems reward discipline, not emotion. However, the rapid trading pace creates uniquely challenging conditions that the right scalping tools and forex broker can solve.</p> <h2>Ready to Choose the Best Broker for Scalping?</h2> <p>For a professional scalper, execution speed and spread can make or break a trade. Even a spread wider than 1 pip can eliminate your edge.</p> <p>As one of the best brokers for scalping, ThinkMarkets provides ultra-low latency, fast execution, and tight spreads on major currency pairs.</p> <p>For beginner scalpers, ThinkTrader has a minimum deposit of just $50 and can be traded on our web version or via TradingView. For professionals, ThinkZero provides institutional-grade pricing and over 4,000 trading instruments to choose from. Most importantly, ThinkZero offers raw spreads from 0.0 pips, ideal for high-speed trading.</p> <p><img alt="Scalping trading platform (ThinkMarkets)" src="/getmedia/a896913e-72b2-4b26-8fad-85e8db7b34e1/Academy-Forex-scalping-zig-zag-trend-continuation-short-trade-with-macd-confirmation-gbpusd-1d-chart-4.png" /></p> <p>ThinkMarkets Zero-Spread and Other Account Types</p> <p>Other important features for scalping include:</p> <ul> <li>One-click execution for quick entries and exits</li> <li>Tick scalping for minute price exploitation</li> <li>Stable spreads during volatile periods</li> <li>High performance during major sessions</li> <li>No minimum holding time rules</li> <li>Excellent liquidity on major pairs</li> </ul> <div> <style type="text/css">.didyouknow { display: block; background: #F1FDf0; width: 600px; border-radius: 20px; gap: 20px; padding-top: 48px; padding-right: 40px; padding-bottom: 48px; padding-left: 40px; font-family: Figtree; font-weight: 600; font-size: 22px; line-height: 140%; letter-spacing: 0%; } </style> </div> <div class="didyouknow">Start scalping with spreads from 0.0 pips on our <a href="https://www.thinkmarkets.com/nz/zero-account/">ThinkZero</a> account</div> <h2>Still Not Sure if Forex Scalping is Right for You?</h2> <p>Forex scalping requires precise execution and rapid decision-making. Rather than holding overnight positions, scalper traders capitalise on several small price adjustments throughout a trading day.</p> <p>This high-risk trading approach suits those who can follow strict plans, maintain focus for extended periods of time and handle active trading.</p> <p>To start, here are some scalping tips:</p> <ul> <li>Test your scalping method on a demo before live scalping</li> <li>Master one FX scalping strategy before adding others</li> <li>Track your trading performance metrics in a journal</li> <li>Start with small positions and increment once profitable</li> <li>Continuously refine strategies through journal analysis</li> </ul> <p>If you prefer fewer hassles with fewer trades that yield larger rewards, consider day trading, swing trading, or position trading as alternatives.</p> <p>Remember that scalping trading for beginners demands focus, but it can offer a dynamic approach for active traders.</p> <div> <style type="text/css">.didyouknow { display: block; background: #F1FDf0; width: 600px; border-radius: 20px; gap: 20px; padding-top: 48px; padding-right: 40px; padding-bottom: 48px; padding-left: 40px; font-family: Figtree; font-weight: 600; font-size: 22px; line-height: 140%; letter-spacing: 0%; } </style> </div> <div class="didyouknow">Still curious? <a href="https://portal.thinkmarkets.com/account/login">Begin</a> your scalping journey with ThinkMarkets in minutes.</div>
Forex Fundamental Analysis: Definition, Drivers & Trading Methodology
<p>Forex fundamental analysis is a type of analysis used in trading to gain a deeper understanding of the factors that move the foreign exchange market. Unlike technical analysis, which tells you "what" is happening, fundamental analysis in forex reveals "why" it's happening, giving you an edge in an increasingly competitive forex market.</p> <p>Did you know that 85% of chief forex dealers in London rely more on trading fundamentals than technical analysis? According to the Bank of England's study, "Charts and Fundamentals in the Foreign Exchange Market," these professional traders understand that while charts may show where the price has been, it's fundamentals that truly drive where it's going.</p> <p>Forex fundamental analysis can give you the power to see beyond <a href="/en/trading-academy/technical-analysis/day-trading-chart-patterns/">price patterns</a> by examining the underlying aspects that make up the intrinsic value of a country's currency, including economic, monetary, and capital flow factors.</p> <p>In this article, we will go through:</p> <ul> <li>The three pillars of fundamental analysis that drive the majority of significant currency movements</li> <li>How to interpret like a pro major economic indicators that affect forex markets, focusing on what truly matters</li> <li>Why do different currency types, from reserve to commodity currencies, respond to fundamentals and affect various currency groups in different ways</li> <li>Catalysts and a step-by-step methodology to transform fundamental data into forex fundamental trading strategies</li> </ul> <p>Whether you're struggling to understand sudden market moves or looking to build more conviction in your trades, mastering fundamental analysis may transform how you approach the forex market forever.</p> <div> <style type="text/css">.didyouknow { display: block; background: #F1FDf0; width: 600px; border-radius: 20px; gap: 20px; padding-top: 48px; padding-right: 40px; padding-bottom: 48px; padding-left: 40px; font-family: Figtree; font-weight: 600; font-size: 22px; line-height: 140%; letter-spacing: 0%; } </style> </div> <div style="text-align: center;"> <style type="text/css">.btn { font: Figtree; justify-content: center; align-items: center; text-align: center; gap: 7px; font-style: normal; font-size: 18px; line-height: 24px; padding: 13px 20px; border: 1px solid #ddd; border-radius: 38px; background: #5EE15A; } </style> </div> <div class="didyouknow">Ready to Dive Into Forex Fundamental Analysis?<br /> <br /> <a class="btn" href="https://portal.thinkmarkets.com/account/individual/demo/" style="text-decoration: none; font-weight: 500; color: #000000; background: 5EE15A;" target="_blank">Open a Demo and Start Testing Today!</a></div> <h2>What is Fundamental Analysis in Forex</h2> <p>A fundamental analysis definition in <a href="/en/trading-academy/forex/what-is-forex-trading/">forex</a> sees the type of analysis as the systematic evaluation of economic, financial, political, and social factors that influence currency valuations across global markets. Unlike chart analysis, fundamental analysis in forex focuses on causal relationships between economic variables and exchange rates.</p> <p>At its core, this forward-looking method examines:</p> <ol> <li><strong>Economic strength indicators:</strong> GDP growth, employment figures, inflation rates, and productivity metrics</li> <li><strong>Monetary policy dynamics:</strong> Interest rate trajectories, quantitative measures, and central bank decisions/communications</li> <li><strong>Political stability of a country:</strong> Governance quality, regulatory environment, international relations, and geopolitical positioning*</li> <li><strong>Market sentiment:</strong> Risk appetite, positioning extremes, market volatility metrics, and carry trade dynamics</li> </ol> <p>*For a deeper understanding of how geopolitics work in forex, visit our article Impact of Geopolitical Events on Forex Markets.</p> <p><img alt="Fundamentals in Forex Trading (ThinkMarkets)" src="/getmedia/6fc7f504-8e95-4b8e-a305-b24d6bbb195c/Academy-Forex-Fundamental-Analysis-4-Core-Fundamental-Analysis-Elements-in-Forex-Markets.png" /></p> <p style="text-align: center;">4 Core Fundamental Analysis Elements in Forex Markets</p> <p>Note that market sentiment is not as much a fundamental element as it is based on market psychology. It often bridges both technical and fundamental analysis, as traders often use both to form a complete market view. While fundamentals provide the underlying narrative, sentiment reflects how market participants interpret and act on this information.</p> <h3>Technical vs Fundamental Analysis</h3> <p>The key differences between fundamental and technical analysis include:</p> <ul> <li>Focuses on the "why" behind price movements rather than just "how" prices move</li> <li>Utilises macroeconomic data rather than price patterns and chart formations</li> <li>Operates across multiple timeframes with emphasis on longer-term economic cycles</li> <li>Considers inter-market relationships and global capital flows</li> </ul> <p>To learn more about technical analysis, go to our article: Technical Analysis in Forex: Definition, Charts & Strategy Method.</p> <h2>Why is Fundamental Analysis Important for Forex Traders</h2> <p>Forex fundamental analysis can help traders really understand current market conditions and spot potential trading opportunities. However, it can also assist them in various other ways. In particular, it enables forex traders:</p> <h3>1. Understand Economic Indicators and Market Catalysts</h3> <p>When changes in economic data and policy are major, they often trigger market moves so large that technical analysis alone cannot predict them. And when these major economic shifts happen, knowing the underlying economic factors driving them prevents forex traders from being blindsided by sudden price movements.</p> <h3>2. Improve Decision-Making in Trading</h3> <p>Knowledge of forex fundamentals can help traders build stronger conviction in their trading decisions and may even allow them to hold positions through market noise. By learning fundamental relationships, they can better differentiate between brief fluctuations and real trend reversals. In turn, this allows them to scale position sizes with greater confidence.</p> <h3>3. Manage Risk More Effectively</h3> <p>Forex traders can anticipate potential volatility catalysts in advance as well as identify key risk events. This helps them assess how vulnerable the market might be to surprises and protect their positions during fundamental changes.</p> <p>Knowledge of fundamental relationships enables traders to make more informed trading decisions about currency pricing in response to changing conditions.</p> <h2>The Three Pillars of Forex Fundamental Analysis</h2> <p>To start employing fundamental analysis in forex, one must first understand the three interconnected pillars that can drive the value of a currency:</p> <p><img alt="Pillars of Forex Fundamental Analysis (ThinkMarkets)" src="/getmedia/ba8486bd-6010-4415-9a3e-9d530d471633/Academy-Forex-Fundamental-Analysis-Three-Pillars-of-Fundamental-Analysis-Forex.png" /></p> <p style="text-align: center;">Three Pillars of Fundamental Analysis, Forex</p> <h3>1. Macroeconomic Performance Differentials</h3> <p>When comparing a country's economy to another, relative performance matters more than absolute values. Strong currencies typically arise from economies showing:</p> <ul> <li>Higher GDP growth rates compared to trading partners (differential of 1%+ sustained over quarters)</li> <li>Positive productivity trends signalling sustainable expansion potential</li> <li>Strong employment data showing labour market health beyond headline unemployment figures</li> <li>Stable inflation within target bands indicates economic balance</li> </ul> <p>Key economic indicators within this pillar include:</p> <ul> <li><strong>Growth differentials:</strong> Affect long-term capital allocations</li> <li><strong>Inflation differentials:</strong> Impact of currency competitiveness and long-term value</li> <li><strong>Employment trends:</strong> Signal economic health and potential policy shifts</li> <li><strong>Productivity metrics:</strong> Indicate sustainable growth potential</li> </ul> <p>For a deep dive into these indicators, refer to our previous article on <a href="/en/trading-academy/indicators-and-patterns/what-are-forex-economic-indicators-and-how-they-impact-forex/">What Are Forex Economic Indicators and How They Impact Forex Trading</a>.</p> <h3>2. Monetary Policy Divergence</h3> <p>Interest rate decisions explain much of the differential movement in developed market currencies. This pillar examines:</p> <ul> <li>Real yield differentials (nominal yields minus inflation) between currency pairs</li> <li>Central bank cutting and raising interest rates (easing/tightening) and their relative positioning</li> <li>Balance sheet policies (quantitative easing/tightening) affecting liquidity</li> <li>Forward guidance disparities signalling future policy intentions</li> </ul> <p>The central bank policy framework includes:</p> <ul> <li><strong>Reaction Function Parameters:</strong> Define policy responses to economic conditions</li> <li><strong>Dual vs. Single Mandate Prioritisation:</strong> Influences predictability of policy responses</li> <li><strong>Forward Guidance Credibility:</strong> Affects market response to communications</li> <li><strong>Quantitative Policy Impact:</strong> Influences both currency values and economic activity</li> </ul> <p><strong>Tip:</strong> The 2-year government bond yield spread between economies shows a particularly strong correlation with exchange rate movements, serving as a proxy for expected monetary policy divergence—for example, USD/JPY currency correlation with US-Japan 2-year yield spread.</p> <p><img alt="Currency Correlation (ThinkMarkets)" src="/getmedia/c6a59974-f340-4f6d-ae7e-4c0600f4bdf0/Academy-Forex-Fundamental-Analysis-High-Importance-Forex-Economic-Events-G7-ThinkMarkets-Trader-Platform-Calendar.png" /></p> <p style="text-align: center;">USD/JPY vs US-Japan 2-year spread</p> <h3>3. Capital Flow Analysis</h3> <p>This pillar examines capital movements that drive currency demand:</p> <p><strong>Capital Flow Components:</strong></p> <ul> <li>Current account balances as a percentage of GDP (surplus currencies tend to appreciate)</li> <li>Foreign direct investment patterns indicate long-term economic confidence</li> <li>Portfolio investment flows into equity and debt markets</li> <li>Foreign ownership percentages of local debt markets (early warning for EM currencies)</li> </ul> <p><strong>Key capital flow indicators within this pillar include:</strong></p> <ul> <li><strong>Current Account/GDP Ratio:</strong> Indicates fundamental currency pressure</li> <li><strong>Foreign Direct Investment Trends: </strong>Shows long-term confidence</li> <li><strong>Portfolio Flow Patterns:</strong> Reveals short-term market sentiment</li> <li><strong>External Debt Metrics</strong>: Highlights potential vulnerability to outflows</li> </ul> <p>However, specific fundamentals do not exert the same influence on currency pricing.</p> <h2>How Do Fundamentals Transmit to Currency Prices</h2> <p>The transmission from fundamentals to currency prices operates through multiple channels working simultaneously but at different velocities:</p> <p><img alt="Fundamental Drivers of Currency Pricing (ThinkMarkets)" src="/getmedia/b8e1df9c-0ff2-4e30-8c6c-0d2b56317faa/Academy-Forex-Fundamental-Analysis-Key-Transmission-Channels-of-Fundamentals-into-Currency-Prices.png" /></p> <p style="text-align: center;">Key Transmission Channels of Fundamentals into Currency Prices</p> <p><strong>Interest Rate and Capital Flow Differentials:</strong> Currencies with higher interest rates (real rates) tend to attract capital inflows, creating upward pressure on their exchange rates. Similarly, strong economic growth attracts foreign investment.</p> <p><strong>Risk Appetite Dynamics:</strong> Global uncertainty drives capital toward currencies perceived as stable stores of value, particularly the US dollar, the Swiss franc, and the Japanese yen, during market stress.</p> <p><strong>Market Expectations and Forward Pricing:</strong> Markets price currencies based on anticipated future conditions rather than current data, which explains why expected policy shifts often impact prices before they are implemented.</p> <p>These transmission mechanisms can operate across distinct timeframes:</p> <ul> <li><strong>Short-term (intraday to weekly):</strong> Data releases, central bank communications</li> <li><strong>Medium-term (weekly to monthly):</strong> Monetary policy cycles, inflation trends</li> <li><strong>Long-term (monthly to yearly):</strong> Growth differentials, structural economic changes</li> </ul> <p>Understanding these timeframes helps forex traders align their analysis horizon with their fundamental trading strategy, from news trading strategies to position trading.</p> <h3>Currency-Specific Transmission Patterns</h3> <p>Currencies are not created equal, as their pricing reflects different fundamental factors. Different currency types respond to these transmission mechanisms in distinct ways, requiring traders to tailor their analysis accordingly. There are three different types of currencies, each with its own transmission channels.</p> <h4>Reserve Currencies (USD, EUR, GBP, CHF, JPY)</h4> <p>To trade forex, one must assess global situations alongside domestic market fundamentals when it comes to reserve currencies, i.e., major currency pairs.</p> <h4>Primary Transmission Channels</h4> <ul> <li><strong>Monetary Policy:</strong> Federal Reserve decisions and Treasury yields drive USD</li> <li><strong>Safe-Haven Flows:</strong> Risk-off periods strengthen CHF and JPY</li> <li><strong>Institutional Capital Flows:</strong> Deep markets enable fast transmission</li> </ul> <p>The US dollar holds a dominant <a href="https://data.imf.org/en/news/4225global+fx+reserves+decreased+by+3+percent+in+2024q4" target="_blank">reserve status</a> (approx 60% according to the IMF), which strengthens its response to Fed policy, while the euro reflects ECB decisions across a fragmented eurozone. The Swiss franc and Japanese yen often move counter to their domestic fundamentals during periods of market stress, displaying <a href="/en/trading-academy/commodities/what-is-gold-trading-why-trade-gold/">safe-haven</a> characteristics.</p> <p>These major currencies are highly liquid and see their relative market values refreshed around the clock by constant data releases <a href="/en/trading-academy/forex/sessions/">from Sydney to New York</a>. Traders may focus on inflation and employment figures, notably the US non-farm payrolls, to mould their views on each currency’s fundamentals.</p> <h4>Commodity Currencies (AUD, NZD, CAD, NOK, RUB)</h4> <p>Analysing these currencies requires following both domestic conditions and commodity prices. For example, copper and iron ore take a significant chunk of Australia’s exports, and their prices tend to weigh on the currency.</p> <h4>Primary Transmission Channels</h4> <ul> <li><strong>Terms of Trade:</strong> Commodity price movements</li> <li><strong>Global Growth Cycles:</strong> Trade volume impact</li> <li><strong>Risk Appetite:</strong> Pro-cyclical behaviour</li> </ul> <p>These currencies show a strong correlation with their key export commodities: copper and iron ore for AUD, dairy for NZD, and oil for CAD, NOK, and RUB. Chinese economic data often drives AUD and NZD moves through its impact on commodity demand.</p> <h4>Emerging Market Currencies (CNH, CZK, HUF, PLN, ZAR)</h4> <p>They display increased sensitivity to global risk appetite and the strength of the US dollar.</p> <h4>Primary Transmission Channels</h4> <ul> <li><strong>Global Risk Sentiment:</strong> Quick transmission through capital flows</li> <li><strong>External Vulnerability Metrics:</strong> Current account and debt levels</li> <li><strong>Political Risk Premium:</strong> Institutional stability impact</li> </ul> <p>These currencies show increased sensitivity to the strength of the USD and global risk appetite, with political developments often triggering rapid capital flow responses. Central banks generally lack credibility, and let inflation run out of control, which makes these currencies particularly volatile.</p> <h2>How to Use Fundamental Analysis in Forex Trading</h2> <p>Successful fundamental analysis trading requires a systematic method for translating fundamental insights into tradeable opportunities. The following step-by-step framework may help traders and investors move from analysis to execution while maintaining disciplined risk management.</p> <h3>Step 1 - Implement Analysis Driven by Fundamental Data</h3> <p>To trade forex using fundamental analysis, one has to be able to:</p> <ul style="list-style: none;"> <li>A. Understand market reactions</li> <li>B. Implement data hierarchy</li> <li>C. Verify fundamental signals</li> </ul> <h4>A. Understand Market Reactions</h4> <p>Skilled fundamental traders who do fundamental trading know that market reactions to data releases depend more on deviations from expectations than on absolute values or technicals for that matter.</p> <p>As markets show different sensitivity to economic indicator surprises, data that exceeds certain thresholds is more meaningful in terms of risk and opportunity. Some of the thresholds that may drive outsized market repositioning are seen in the table below.</p> <p><img alt="Major Economic Reports Deviations and Impact on Currencies (ThinkMarkets)" src="/getmedia/c90fa025-a69d-4e63-b136-ce0ad39ddca7/Academy-Forex-Fundamental-Analysis-Major-Economic-Reports-Deviations-and-Impact-on-Currencies-ThinkMarkets.png" /></p> <p style="text-align: center;">Economic Release Numbers Threshold and Impact</p> <p>Note that at times, revisions may have a greater market impact than their initial releases, but novice investors and traders often overlook them.</p> <h4>B. Implement Data Hierarchy</h4> <p>Hard economic data from government statistics, including GDP, employment, inflation and trade balance, provide the most authoritative readings as they may influence central bank decisions.</p> <p>Survey data like business confidence and purchasing manager surveys offer secondary insights, while composite indices help with broader economic trends.</p> <p>Market-based fundamental indicators, such as risk reversals and institutional positioning reports, complete the hierarchy, providing real-time sentiment feedback.</p> <p>Here’s a table with what economic report data is most reliable and examples of what they can change:</p> <p><img alt="Major Forex Economic Data Reliability (ThinkMarkets)" src="/getmedia/afdd1c70-a43b-40bf-8784-9166bd404059/Academy-Forex-Fundamental-Analysis-Major-Forex-Economic-Data-Reliability-ThinkMarkets.png" /></p> <p style="text-align: center;">Which Economic Data Category is Most Reliable in Forex</p> <p>Understanding this hierarchy can help forex traders to weigh information appropriately when building positions.</p> <h4>C. Verify Fundamental Signals</h4> <p>In an attempt to raise the odds of success, fundamental analysts employ multiple verification methods in trading fundamental analysis:</p> <ul> <li>Data triangulation compares primary statistics with secondary confirmation</li> <li>Cross-verification analyses aim to align with leading economic indicators</li> <li>Cross-asset verification ensures fundamental alignment in broader financial markets</li> </ul> <h3>Step 2 - Align Fundamental and Technical Analysis</h3> <p>The alignment method helps with entry and risk management, with the fundamental part identifying the directional bias and the technical part timing entries for favourable risk-reward.</p> <p>Key support and resistance provide natural entry points when fundamental catalysts fuel volatility, and momentum indicators could confirm this narrative. Fundamental traders may prefer to pay special attention to technical breakouts that support fundamental drivers, as they may lead to sustained market trends.</p> <p>A divergence between expectations and price action may signal trend changes. When fundamentals fail to produce the expected breakouts, the market positioning may be incorrect or signal a turn.</p> <h3>Step 3 - Plan Entries based on Fundamental Catalysts</h3> <p>Catalyst-driven entries are based on specific events or data. Proper identification and execution are essential to capture alpha while managing risk.</p> <p>Clearly defined fundamental triggers set specific conditions to open a position. High-probability setups stem from large deviations from market expectations, so thresholds ensure that trades are opened only when an event is of significant importance.</p> <p>Pre-established execution parameters define exact entries ahead of events, which helps eliminate emotional decision-making in the heat of the moment. They include execution timeframes (e.g. 5 minutes post-release) and confirmation signals such as breakout candles.</p> <p>Risk-adjusted position sizing accounts for increased volatility and uncertainty surrounding trade execution. Traders may reduce their usual ticket sizes by half to offset wider spreads, slippage, and gaps.</p> <p>Liquidity considerations require traders to be aware of the market depth surrounding data releases. Spreads can widen a lot in the first minutes, and traders might want to wait for them to normalise before going in.</p> <h3>Step 4 - Determine Position Size from Fundamental Conviction</h3> <p><a href="/en/trading-academy/forex/position-sizing-guide/">Trade sizes</a> should reflect the conviction that a trader has in the fundamental narrative. Strong divergence suggests that larger positions may be opened when economic data show heavy deviations from consensus, as the market response could unwind previous positioning.</p> <p>Confirmation with multiple indicators increases the odds of a solid trade, and in turn, validates the corresponding position size. On the one hand, this prevents over-sizing on a single data point, while on the other hand, it helps with gains from the previously mentioned fundamental alignment.</p> <p>Existing market positioning should also be taken into account when adjusting the trade size, based on whether the fundamental view aligns with the prevailing market trend. If so, positions may be reduced, as favourable developments may already be reflected in the price.</p> <p>As a rule of thumb, a systematic method would set capital allocation as follows:</p> <ul> <li>0.5% risk for weak and mid-strength fundamental divergence</li> <li>1% risk for fundamental-technical alignment setups</li> <li>Up to 2% for fundamental signals confirmed by several indicators</li> </ul> <h3>Step 5 - Work Out a Fundamental Stop Loss</h3> <p>These are triggered when the underlying story becomes invalid. Traders must monitor a country's <a href="/en/trading-academy/market-events/how-to-use-the-thinkmarkets-economic-calendar/">economic calendar</a> for data, policy developments, and market conditions to determine whether fundamental assumptions remain valid. For example, a long USD position based on Fed tightening should be closed if the central bank signals a dovish stance, regardless of the price action.</p> <p>Invalidation usually takes shape gradually through several data points, and traders can set their checkpoints accordingly to spot when the tide turns. This prevents holding onto losers when the underlying condition evolves while avoiding premature exits due to market noise.</p> <h3>Step 6 - Project Target based on Fundamental Model</h3> <p>Traders can set their profit objectives based on fundamental developments, by looking at historical price data or forward-looking models.</p> <ul> <li><strong>Historical Reactions:</strong> Similar market fundamentals have set expectations based on previous events. These deja vu patterns help traders focus on targets with historical precedent.</li> <li><strong>Interest Rate Differential Trajectory:</strong> It acts as a projection of forex movements from monetary policy divergence. Forward rate curve reveals expectations for each country’s interest rate path, and an increased differential would justify larger targets.</li> </ul> <p>Using multi-timeframe analysis, traders can set targets whenever there is alignment between technical indicators and fundamental data. Short-term targets may serve as support and resistance for partial profit-taking, while longer-term targets would be part of overall position management.</p> <div> <style type="text/css">.didyouknow { display: block; background: #F1FDf0; width: 600px; border-radius: 20px; gap: 20px; padding-top: 48px; padding-right: 40px; padding-bottom: 48px; padding-left: 40px; font-family: Figtree; font-weight: 600; font-size: 22px; line-height: 140%; letter-spacing: 0%; } </style> </div> <div style="text-align: center;"> <style type="text/css">.btn { font: Figtree; justify-content: center; align-items: center; text-align: center; gap: 7px; font-style: normal; font-size: 18px; line-height: 24px; padding: 13px 20px; border: 1px solid #ddd; border-radius: 38px; background: #5EE15A; } </style> </div> <div class="didyouknow">Want to Apply this Framework in Real-Time? Open a Risk-Free Demo Account and Practice with virtual funds.<br /> <br /> <a class="btn" href="https://portal.thinkmarkets.com/account/individual/demo/" style="text-decoration: none; font-weight: 500; color: #000000; background: 5EE15A;" target="_blank">Start Demo Trading Here!</a></div> <h2>Trading Fundamentals on EURUSD: Central Bank & Interest Rate Idea</h2> <p>Below, we present a fundamental <a href="/en/trading-academy/forex/popular-forex-trading-strategies/">trading strategy</a> on EURUSD, along with a brief analysis of the step-by-step methodology.</p> <p><strong>Initial Market Context</strong></p> <ul> <li>European Central Bank (ECB) expected to deliver 4 rate cuts vs the Fed's 2 cuts in 2025</li> <li>Eurozone showing improved economic outlook</li> <li>Business activity returning to growth trajectory</li> <li>Euro finding bottom near the 1.0200 round support as market sentiment shifts</li> </ul> <p><img alt="EURUSD Fundamental Trade (ThinkMarkets)" src="/getmedia/857bb98f-f1be-4524-8c90-24af146abf6d/Academy-Forex-Fundamental-Analysis-EURUSD-Trade-based-on-ECB-Rhetoric-Shift-Fundamental-Conviction.jpg" /></p> <p style="text-align: center;">EURUSD Trade based on ECB Rhetoric Shift, Fundamental Conviction</p> <h3>Step-by-Step Fundamental Trading</h3> <h4>Step 1 - Central Bank Policy & Data Analysis</h4> <p><strong>Policy Divergence:</strong></p> <ul> <li>Market repositioning ahead of the 6 March meeting</li> <li>ECB March meeting strikes hawkish tone</li> <li>Data-dependent approach signals fewer rate cuts</li> <li>Oil and gas price peaks removing headwinds</li> </ul> <p><strong>Market Validation:</strong></p> <ul> <li>Rally sustained post-meeting</li> <li>Smart money showing conviction in euro recovery</li> <li>Cross-verification with economic indicators is positive</li> </ul> <h4>Step 2 - Technical-Fundamental Alignment</h4> <p><strong>Key Technical Signals:</strong></p> <ul> <li>Double bottom formation in February</li> <li>Breakout above 1.0950 resistance <ul> <li>Earlier short squeeze amplifying upward momentum</li> </ul> </li> <li>Price action confirming hawkish narrative</li> </ul> <h4>Step 3 - Entry Strategy</h4> <p><strong>Fundamental Catalysts:</strong></p> <ul> <li>ECB's shift to 'data-dependent' approach</li> <li>Slowdown in economy; higher rates hurt economy</li> <li>Moderation in wage growth</li> <li>Drop in inflation to 2.2%</li> </ul> <p><strong>Technical Conviction:</strong></p> <ul> <li>Three consecutive bullish candles (<a href="/en/trading-academy/technical-analysis/guide-to-day-trading-triple-candlestick-patterns/">Three White Soldiers</a>)</li> <li>No reversal pattern following post-ECB peak at 1.0950</li> <li>Shallow pullback opportunity end-of-month</li> </ul> <h4>Step 4 - Position Size</h4> <p><strong>High Conviction Setup:</strong></p> <ul> <li>Strong deviation from expectations of more cuts</li> <li>Technical breakout confirmation with a <a href="/en/trading-academy/technical-analysis/single-candlestick-patterns-a-guide-for-day-trading/">Marubozu candle</a></li> <li>Fundamental alignment with growth, wage and inflation</li> <li>Suggested allocation: Up to 2% of capital</li> </ul> <h4>Step 5 - Risk Management</h4> <p><strong>Fundamental Invalidation Points:</strong></p> <ul> <li>Disappointing growth below expectations</li> <li>Rise in wage growth or inflation data</li> <li>ECB policy or member stance reversal</li> <li>Significant geopolitical disruption affecting inflation</li> <li>Institutional positioning shift in the COT report</li> </ul> <h4>Step 6 - Profit Target</h4> <p><strong>Technical Levels:</strong></p> <ul> <li>Partial take-profit at 1.1210</li> <li>Full target at 1.1400</li> </ul> <p><strong>Fundamental Exit Signals:</strong></p> <ul> <li>Deteriorating growth outlook (2 consecutive months)</li> <li>ECB dropping 'data-dependent' language</li> <li>Forward rate curve showing increased ECB accommodation</li> </ul> <p>With an entry at the first breakout candle above 1.0950 at 1.1055, a stop loss 30 pips below the EOM swing low at 1.0700 and a first take-profit mirroring the 1.0178-1.0950 leg, the trade returned 1.88x at 1.1722.</p> <h2>Conclusion</h2> <p>Fundamental analysis is one of the building blocks for trading forex, providing the economic rationale behind prevailing trends. More specifically, macroeconomic differentials, monetary policy divergence and capital flow dictate market fluctuations.</p> <p>Success in trading fundamentals in forex requires understanding that market reactions depend more on deviations from expectations than on absolute values. Savvy traders focus on:</p> <ul> <li>Systematic evaluation of economic data relative to consensus expectations</li> <li>Cross-verification of signals across multiple data sources</li> <li>Integration of fundamental catalysts with technical confirmation</li> <li>Position sizing based on fundamental conviction strength</li> </ul> <p>Remember that forex fundamental analysis isn't as much about collecting economic data or trading economic events. It’s more about understanding the relationships between all fundamental forces and currency valuations. When combined with disciplined execution and proper risk management, this can create a sustainable edge in the forex market.</p>
ZigZag Indicator Signals, Strategies and Integration
<p>The ZigZag indicator is a technical tool used by forex traders to spot chart patterns that may have been otherwise hidden by minor price movements known as “market noise.”</p> <p>By connecting major swing highs and swing lows with trend lines, the ZigZag tool provides a clearer visual context for identifying major turning points and trend continuations. Its graphical clarity reduces trend analysis time and helps navigate through market volatility.</p> <p>Focusing only on meaningful price movements, the Zig Zag indicator is a popular trading tool among swing traders and trend traders. Incorporating the technical indicator into a ZigZag trading strategy can simplify trading analysis and help cut through market noise.</p> <p>In this short trading guide, traders will learn:</p> <ul> <li>What the ZigZag trading indicator is</li> <li>The trading signals provided by the market indicator</li> <li>Different trading strategies to use with the ZigZag</li> <li>Integrating the forex indicator with existing strategies</li> <li>Risk management and best practices</li> </ul> <p>Whether you are looking to trade trends, identify price reversals, or improve your market structure analysis, understanding the Zig Zag indicator can improve your technical trading approach and help you build a proper ZigZag trading strategy.</p> <div> <style type="text/css">.didyouknow { display: block; background: #F1FDf0; width: 600px; border-radius: 20px; gap: 20px; padding-top: 48px; padding-right: 40px; padding-bottom: 48px; padding-left: 40px; font-family: Figtree; font-weight: 600; font-size: 22px; line-height: 140%; letter-spacing: 0%; } </style> </div> <div style="text-align: center;"> <style type="text/css">.btn { font: Figtree; justify-content: center; align-items: center; text-align: center; gap: 7px; font-style: normal; font-size: 18px; line-height: 24px; padding: 13px 20px; border: 1px solid #ddd; border-radius: 38px; background: #5EE15A; } </style> </div> <div class="didyouknow">Ready to Test Your Own ZigZag Trading Strategy?<br /> <br /> <a class="btn" href="https://portal.thinkmarkets.com/account/individual/demo" style="text-decoration: none; font-weight: 500; color: #000000; background: 5EE15A;" target="_blank">Try Here!</a> <br /> <br /> No Strategy? Read Along.</div> <h2>What is the ZigZag Indicator</h2> <p>The ZigZag indicator is a technical analysis tool that connects swing highs and swing lows with straight lines to filter out price moves that exceed a certain threshold.</p> <p><img alt="ZigZag Indicator - ThinkMarkets" src="/getmedia/91bf11cd-9ff2-42d2-8eea-683b68778ef3/Academy-indicators-and-patterns-zigzag-indicator-Formation-of-ZigZag-Straight-Lines.png" /></p> <p style="text-align: center;">Formation of ZigZag Straight Lines</p> <p>While primarily a lagging indicator due to plotting Ziz Zag lines after price action exceeds this threshold, when these pivot points are confirmed (i.e. when the Zig Zag line is plotted), they serve as a powerful leading trend indicator of potential future price continuation.</p> <p>Besides allowing traders to anticipate trend continuation as well as reversal patterns, it boasts advantages over similar trader tools like the Parabolic SAR or the Renko charts:</p> <ul> <li>It focuses on the magnitude of price changes, not on time intervals, which makes it more <strong>effective at identifying major market shifts</strong></li> <li>It maintains the visual context and <a href="/en/trading-academy/technical-analysis/single-candlestick-patterns-a-guide-for-day-trading/">candlestick information</a> of price charts while still filtering noise, which <strong>allows concurrent chart pattern analysis</strong></li> </ul> <p>The Zig Zag indicator helps <a href="/en/trading-academy/forex/">forex traders</a> in several other ways, starting with decluttering their view by highlighting cleaner price patterns while also revealing the underlying market structure and the direction of the trend.</p> <p>Notably, the Zig Zag indicator can assist with recognising parts of harmonics, Elliott waves and several geometry-based <a href="/en/trading-academy/technical-analysis/day-trading-chart-patterns/">chart patterns</a> due to how it marks pivot points. The term ‘Zig Zag’ itself is used extensively with the Elliott Wave Theory to pinpoint corrective wave structures.</p> <p>This combination creates a strong framework for both forex trend analysis and tactical trade execution, which brings us to the importance of understanding how the Zig Zag tool works.</p> <h2>How the Zig Zag Indicator Works</h2> <p>The Zig Zag indicator works by identifying major swing highs or swing lows on price charts based on a defined percentage threshold or deviation set by the user.</p> <p>Once the price movement exceeds this threshold from the previous turning point, the forex <a href="/en/trading-academy/indicators-and-patterns/technical-indicators-beginners-guide/">technical indicator</a> draws a straight trendline connecting these two points. This process continues with each new qualifying pivot point.</p> <p>Here is how this looks on ThinkMarkets GBPUSD 1-day chart on TradingView:</p> <p><img alt="Zig Zag Indicator (ThinkMarkets)" src="/getmedia/5a49526d-cfce-459b-9308-8d96ec70df07/Academy-indicators-and-patterns-zigzag-indicator-on-GBPUSD-1D-chart-ThinkMarkets-TradingView.jpg" /></p> <p style="text-align: center;">Zig Zag Indicator on GBPUSD 1D chart, ThinkMarkets TradingView</p> <p>Naturally, as a technical indicator in trading, the ZigZag can achieve this by a mathematical function - i.e. a formula.</p> <h3>Zig Zag Indicator Highs and Lows Formula</h3> <p>Below is the formula of how the ZigZag indicator calculates when to plot its lines:</p> <p style="text-align: center;"><strong>ZigZag (HL, %change=X, retrace=FALSE, LastExtreme=TRUE)</strong></p> <p style="text-align: center;"><strong>If %change>=X,plot ZigZag</strong></p> <p><strong>Where,</strong></p> <ul> <li><strong>HL</strong> = High/Low price series or closing price series</li> <li><strong>%change</strong> = Minimum price movement, in percentage</li> <li><strong>Retrace</strong> = Answers if change is a retracement of the previous move or an absolute change from peak to trough</li> <li><strong>Last Extreme</strong> = Answers if the extreme price is the same over multiple periods, is the extreme price the first or last observation</li> </ul> <p>The user has control of how the indicator plots ZigZag lines through its settings.</p> <h3>Zig Zag Indicator Settings</h3> <p>The ZigZag indicator has three primary settings:</p> <ol> <li><strong>Depth:</strong> Ensures swing points are major by setting a minimum number of candles</li> <li><strong>Deviation:</strong> Controls the magnitude of price movement required to plot a ZigZag</li> <li><strong>Backstep:</strong> Prevents successive pivot points from being plotted too close together</li> </ol> <p><img alt="ZigZag Indicator Default Settings (ThinkMarkets)" src="/getmedia/a0493442-2995-4046-9d8f-715a37fefbc7/Academy-indicators-and-patterns-zigzag-indicator-Settings-on-GBPUSD-1D-chart-ThinkMarkets-TradingView.jpg" /></p> <p style="text-align: center;">Zig Zag Indicator Settings on GBPUSD 1D chart, ThinkMarkets TradingView</p> <p>Each component of the ZigZag trading indicator functions differently, implying a particular impact during trading.</p> <p>Next is a summary of the ZigZag settings, what each component does and how changing settings can impact trading.</p> <p><img alt="Zig Zag Indicator Trading Signals (ThinkMarkets)" src="/getmedia/6913c198-8c6b-4534-b770-eef0099e6fb8/Academy-indicators-and-patterns-zigzag-indicator-Trading-Signals-ThinkMarkets.png" /></p> <p style="text-align: center;">Zig Zag Indicator Components and How They Function</p> <p>The deviation is a key parameter in the Zig Zag indicator's formula, as it is mainly responsible for how sensitive the indicator is. Generally, the accepted range is 5-15%, where the higher the figure is, the less sensitive the indicator is, which results in filtering out more noise.</p> <p>As a point of reference, scalpers and day traders could aim for 3-5%; in swing trading, traders may target 5-8%; long-term or position traders may opt for 10-15%. However, slight adjustments should be considered in the dynamic forex markets based on the trading session and the forex pair one trades.</p> <h2>What Are the Main Trading Signals of the ZigZag Indicator</h2> <p>The ZigZag indicator provides traders with objective signals by identifying significant price movements and filtering out minor fluctuations. These signals are not direct buy or sell recommendations but rather tools to interpret market structure and plan trades.</p> <p>The Zigzag trading indicator generates three actionable signals (with insights), acting as a trend reversal and trend trading indicator:</p> <ol> <li><strong>Trend reversals</strong> at major swing highs and lows</li> <li><strong>Trend continuations</strong> based on the direction of the ZigZag lines</li> <li><strong>Trend momentum</strong> gauged by length and angle of the ZigZag lines (used when trend trading)</li> </ol> <p>Let us take a closer look at each one separately.</p> <h3>1. Zig-Zag Indicator Trend Reversal</h3> <p>The ZigZag pivot points mark significant reversal points, often aligning with key support and resistance levels. Traders can use pivot points to set stop-loss or profit-taking levels below swing lows (for long trades) or above swing highs (for short trades).</p> <p><img alt="ZigZag Trend Reversal Trade (ThinkMarkets)" src="/getmedia/fc2af4e6-e8e7-40bc-ba03-45a385c4da74/Academy-indicators-and-patterns-zigzag-indicator-Major-Trend-Reversal-Example-GBPUSD-1D-Chart-1.jpg" /></p> <p style="text-align: center;">Major Trend Reversal Example, GBPUSD 1D Chart</p> <p>For intermediate traders, the structures that form at swing highs and lows can be used to make Elliott wave patterns or harmonic patterns easier to identify.</p> <p>On the advanced patterns front, when similar Zig Zag patterns appear, it suggests market rhythm or symmetry, which can be used to inform speculation about future price movements.</p> <h3>2. Zig-Zag Indicator Trend Continuation</h3> <p>The ZigZag reveals a clear market structure by showing higher highs and higher lows in uptrends or lower highs and lower lows in downtrends, confirming the prevailing trend direction. This implies it can be used as a trend following indicator.</p> <p>Notably, when a new ZigZag pivot forms, it signals that the price has reversed by the specified percentage threshold, which can be used as a trend confirmation signal at early turning points. Naturally, the pivot points act as breakout zones in trend continuations.</p> <p><img alt="ZigZag Trend Continuation Trade (ThinkMarkets)" src="/getmedia/c9bede24-f5f0-4457-9622-7e87915be309/Academy-indicators-and-patterns-zigzag-indicator-Trend-Reversal-Turns-into-Trend-Continuation-GBPUSD-1D-Chart-1.jpg" /></p> <p style="text-align: center;">Trend Reversal Turns into Trend Continuation, GBPUSD 1D Chart</p> <h3>3. Zig-Zag Indicator Trend Momentum</h3> <p>Longer ZigZag lines indicate stronger momentum, and shorter consolidation or trend exhaustion. On the other hand, steeper angles suggest strong momentum, while flatter angles may indicate trend exhaustion or reversal potential.</p> <p>In the GBPUSD 1D example below, an angle of 70.68 produced a 420 pips whereas an angle of 73.12 produced 727 pips, nearly twice.</p> <p><img alt="ZigZag Trend Momentum (ThinkMarkets)" src="/getmedia/e91552df-fd77-4a35-8cb0-f28fa3dda957/Academy-indicators-and-patterns-zigzag-indicator-Steeper-Angle-Produces-More-Gains-GBPUSD-1D-Chart-1.jpg" /></p> <p style="text-align: center;">ZigZag Steeper Angle Produces More Gains, GBPUSD 1D Chart</p> <p>The ZigZag length and angle also simplify the process of measuring the required Fibonacci retracement and extension levels. This aids in timing trades.</p> <p>For example, a 10% ZigZag pattern on a weekly chart can reveal the overall trend, while smaller settings, such as 5% on daily charts or 3% on 4-hour charts, may help traders identify shorter-term moves and refine entries.</p> <h2>Examples of ZigZag Trading Strategies</h2> <p>Building on our understanding of the ZigZag trading indicator signals, let us explore two practical trading strategies designed to capitalise on reversals and continuations (with momentum confirmation).</p> <h3>Swing Reversal ZigZag Trading Strategy</h3> <p>Here, traders use the indicator to clearly identify swing highs and swing lows, then trade reversals at those points when confirmed by other indicators or <a href="/en/trading-academy/forex/using-candlestick-patterns-in-forex-day-trading/">candlestick patterns</a>.</p> <p>This ZigZag strategy works best in ranging markets or at the potential end of extended trends, where a reversal is more likely.</p> <p><strong>How It Works:</strong></p> <ul> <li><strong>Identify a Significant Pivot Point:</strong> Wait for the ZigZag to mark a swing low or swing high (visible V-shape and inverted V-shape patterns that often appear in <a href="/en/trading-academy/technical-analysis/what-is-the-dead-cat-bounce-pattern-and-how-to-identify-it/">Dead Cat Bounces</a>).</li> <li><strong>Confirm the Reversal:</strong> Look for confirmation signals such as: <ul> <li>Bullish candlestick patterns (hammer, <a href="/en/trading-academy/technical-analysis/using-double-candlestick-patterns-in-day-trading/">engulfing</a>) at swing lows</li> <li>Bearish candlestick patterns (shooting star, engulfing) at swing highs</li> <li>RSI showing oversold conditions (below 30) at swing lows or overbought (above 70) at swing highs</li> </ul> </li> <li><strong>Execute the Trade:</strong> <ul> <li><strong>For long trades:</strong> Enter after confirmation near the swing low</li> <li><strong>For short trades:</strong> Enter after confirmation near the swing high</li> <li>Set stop-loss just below the recent swing low (for longs) or above the swing high (for shorts)</li> <li>Initially, target the previous swing point, the RSI overbought/oversold</li> </ul> </li> <li><strong>Manage the Position:</strong> <ul> <li>Consider partial profit-taking at the halfway point to the target</li> <li>Trail stops as price moves favorably to lock in profits</li> </ul> </li> </ul> <p>In the GBPUSD 1D long example below, using this method resulted in a gain with a risk-reward ratio of approximately 2x:</p> <ul> <li><strong>Take Profit:</strong> when the RSI closes in the overbought region near 1.29</li> <li><strong>Stop loss:</strong> 30 pips below the last ZigZag swing, measured near 1.22</li> </ul> <p><img alt="ZigZag Trend Trade (ThinkMarkets)" src="/getmedia/beb3f04d-0907-4a03-8569-99fd5f525102/Academy-indicators-and-patterns-zigzag-indicator-RSI-Reversal-Long-Trade-with-Trend-Confirmation-GBPUSD-1D-Chart-1.jpg" /></p> <p style="text-align: center;">ZigZag RSI Reversal (Long) Trade with Trend Confirmation, GBPUSD 1D Chart</p> <h3>Trend Following ZigZag Trading Strategy</h3> <p>This strategy combines the ZigZag's trend signal with trendline analysis to capture continuation moves after pullbacks. It works best in trending markets with regular pullbacks, particularly effective on daily and 4-hour charts.</p> <p><strong>How It Works:</strong></p> <ul> <li><strong>Identify the Dominant Trend:</strong> Use this indicator to confirm higher highs and higher lows (uptrend) or lower highs and lower lows (downtrend).</li> <li><strong>Draw Trendlines:</strong> Connect consecutive ZigZag swing highs (for downtrends) or swing lows (for uptrends).</li> <li><strong>Wait for a Pullback:</strong> Look for a counter-trend move that pulls back to the ZigZag lines or forms a new ZigZag leg against the trend.</li> <li><strong>Enter on Continuation Confirmation:</strong> <ul> <li><strong>For uptrends:</strong> Enter long when price bounces off trendline support or breaks above a minor high</li> <li><strong>For downtrends:</strong> Enter short when price rejects from trendline resistance or breaks below a minor low</li> <li>Confirm with volume increase or momentum indicator alignment (MACD crossover)</li> <li>Place a stop-loss beyond the most recent counter-trend ZigZag pivot</li> </ul> </li> <li><strong>Monitor Zigzag Momentum Signals:</strong> <ul> <li>Watch for ZigZag line characteristics during the trade</li> <li><strong>Strong momentum:</strong> long ZigZag legs with steep angles in trend direction</li> <li><strong>Weakening momentum:</strong> shorter ZigZag legs with flatter angles</li> <li><strong>Warning sign:</strong> counter-trend ZigZag moves deepening beyond 50% retracement</li> </ul> </li> <li><strong>Take Profit Approaches:</strong> <ul> <li>Use Fibonacci extensions (127.2% or 161.8%) of the pullback move</li> <li>Target the length of the previous ZigZag leg in the trend direction</li> <li>Implement a trailing stop based on subsequent ZigZag pivots</li> <li>Consider scaling out when ZigZag momentum shows signs of weakening</li> </ul> </li> </ul> <p>In the GBPUSD 1D short example below, using this method resulted in a gain with a risk-reward ratio of approximately 2x:</p> <ul> <li><strong>Take Profit:</strong> at 161.8% of the prior major Zig Zag near 1.21</li> <li><strong>Stop loss:</strong> 30 pips above the last ZigZag swing, measured near 1.3070</li> </ul> <p><img alt="Zig Zag Trend Trade (ThinkMarkets)" src="/getmedia/2ee9b913-9226-4886-809f-50ca2c4203cb/Academy-indicators-and-patterns-zigzag-indicator-Trend-Continuation-Short-Trade-with-MACD-Confirmation-GBPUSD-1D-Chart-1.jpg" /></p> <p style="text-align: center;">Zig Zag Trend Continuation (Short) Trade with MACD Confirmation, GBPUSD 1D Chart</p> <p>By keeping a close eye on the length, angle, and pattern of ZigZag lines throughout a trade, traders can manage their positions more effectively, hold through periods of strong momentum and reduce exposure when momentum begins to wane.</p> <h3>Additional ZigZag Trading Strategies</h3> <p>Beyond these three core strategies, traders often implement several other ZigZag-based approaches:</p> <ol> <li><strong>Fibonacci Confluence Strategy:</strong> Uses ZigZag pivot points as anchors for Fibonacci retracement and extension levels to identify precise entry and exit points during trends.</li> <li><strong>ZigZag Channel Trading:</strong> Forms price channels by connecting consecutive ZigZag swing highs and lows, then trades bounces within the channel or breakouts from it.</li> <li><strong>Pattern Recognition Strategy:</strong> Uses the ZigZag to more clearly visualise classic chart patterns like double top and double bottom patterns, head and shoulders, or <a href="/en/trading-academy/technical-analysis/using-double-candlestick-patterns-in-day-trading/">triangles</a> that might be obscured in noisy price action.</li> <li><strong>Elliott Wave Analysis:</strong> Leverages the ZigZag's filtering capability to more accurately count waves and identify potential market reversals.</li> </ol> <p>Each of those ZigZag trading strategies can be adjusted based on trading style, risk tolerance, and the markets one trades.</p> <h2>How to Use the Zig Zag Indicator In A Strategy</h2> <p>The process of integrating the ZigZag trading indicator into a trading strategy involves the following steps:</p> <p><strong>Step 1 - Select the Indicator:</strong> Add the Zigzag from the indicator list.</p> <p><strong>Step 2 - Set Initial Parameters:</strong> Set the deviation at a 5% threshold for a balanced view (or use trading platform default settings).</p> <p><strong>Step 3 - Adjust Visual Properties:</strong> Adjust visuals; line colour, thickness, and style for clear chart reading.</p> <p><strong>Step 4 - Fine-Tune Settings:</strong> Adjust depth, deviation, and backstep parameters according to your target market and timeframe.</p> <p><strong>Step 5 - Analyse Price Structure:</strong> Monitor how the indicator connects recent highs and lows, focus on swing patterns, trend direction and potential reversal zones, and pay attention to ZigZag characteristics (length, angle, pattern) that may suggest trend continuation or exhaustion.</p> <p><strong>Step 6 - Plan Your Trade:</strong> Align entries with additional confirmation tools, such as support/resistance levels, momentum indicators, or candlestick patterns. Set logical stop-loss levels near recent ZigZag pivots and determine take-profit targets based on previous ZigZag waves or Fibonacci levels.</p> <p>A part of integrating the ZigZag into a trading strategy, as revealed in step 4, is adjusting its settings based on the forex pair one trades.</p> <h2>Adjusting Settings for Different Forex Markets</h2> <p>This allows traders to align the forex trading indicator with their own volatility levels and price behaviour.</p> <p>Here are examples of settings to use for all three pair types (of course, one can create their own), along with the rationale behind the changes:</p> <p><img alt="ZigZag Indicator Forex Settings (ThinkMarkets)" src="/getmedia/96d3bde3-890c-4b60-967d-5aa7fd952d45/Academy-indicators-and-patterns-zigzag-indicator-Forex-Settings-ThinkMarkets.png" /></p> <p style="text-align: center;">Adjusting ZigZag Indicator Settings for Forex</p> <p><strong>Major pairs:</strong> Less volatile, highly liquid markets require moderate settings to identify meaningful swings without excessive filtering. The backstep ensures the indicator doesn’t plot two swing highs or lows too close together, which keeps the structure of the ZigZag lines clear and readable.</p> <p><strong>Cross pairs:</strong> Higher volatility needs slightly increased thresholds to filter minor price fluctuations. Slightly higher settings smooth out market noise while maintaining responsiveness.</p> <p><strong>Exotic pairs:</strong> Extreme volatility requires more aggressive filtering to identify truly significant price movements. Wider ZigZag parameters help the indicator identify only significant turning points in these unpredictable markets.</p> <p>Naturally, another consideration for integrating the ZigZag into a strategy is the timeframes.</p> <h3>Timeframe Considerations</h3> <p>Different timeframes serve distinct trading objectives when using the ZigZag indicator:</p> <ul> <li><strong>Lower timeframes (15M-1H):</strong> The indicator can be used with tighter settings for intraday trading, though they contain more noise</li> <li><strong>4-Hour charts:</strong> Provide frequent trading opportunities while maintaining reasonable signal reliability</li> <li><strong>Daily charts:</strong> Offer excellent balance between signal quality and timeliness for most ZigZag strategies</li> <li><strong>Weekly charts:</strong> Ideal for identifying major trend changes and suited for position trading</li> </ul> <p>Swing traders typically find the 4H and daily timeframes most effective, while position traders benefit from weekly chart analysis. For a comprehensive approach, consider using multiple timeframes with coordinated ZigZag settings to confirm reversal and trend signals across different time perspectives.</p> <div> <style type="text/css">.didyouknow { display: block; background: #F1FDf0; width: 600px; border-radius: 20px; gap: 20px; padding-top: 48px; padding-right: 40px; padding-bottom: 48px; padding-left: 40px; font-family: Figtree; font-weight: 600; font-size: 22px; line-height: 140%; letter-spacing: 0%; } </style> </div> <div style="text-align: center;"> <style type="text/css">.btn { font: Figtree; justify-content: center; align-items: center; text-align: center; gap: 7px; font-style: normal; font-size: 18px; line-height: 24px; padding: 13px 20px; border: 1px solid #ddd; border-radius: 38px; background: #5EE15A; } </style> </div> <div class="didyouknow">Test Your Forex ZigZag Strategy on ThinkMarkets TradingView<br /> <br /> <a class="btn" href="https://portal.thinkmarkets.com/account/individual/demo" style="text-decoration: none; font-weight: 500; color: #000000; background: 5EE15A;" target="_blank">Here!</a></div> <h2>Integrating the ZigZag Trading Indicator into Your Strategy</h2> <p>To demonstrate how to integrate the ZigZag trading indicator into your trading strategy effectively, let us examine a couple of key application scenarios.</p> <h3>Trend-Following ZigZag Strategy with EMA and RSI Technical Indicators</h3> <p>This example shows how to use the ZigZag indicator to improve a classic trend following strategy on the USDCAD 1D chart, using the <a href="/en/trading-academy/indicators-and-patterns/rsi-indicator/">Relative Strength Index</a> (RSI) and the Exponential Moving Average (EMA).</p> <p>Setup: ZigZag (14 depth, 5% deviation, 5 backsteps) + 100 EMA + RSI (14)</p> <p><img alt="ZigZag Trading Strategy (ThinkMarkets)" src="/getmedia/4ebea59f-47e0-40c6-92ae-5b4aeafb314c/Academy-indicators-and-patterns-zigzag-indicator-Strategy-with-EMA-and-RSI-Confirmation-USDCAD-1D-Chart-1.jpg" /></p> <p style="text-align: center;">Zig Zag Strategy with EMA and RSI Confirmation, USDCAD 1D Chart</p> <p><strong>Signal:</strong></p> <ul> <li>ZigZag confirmed a higher high and higher low, validating the uptrend</li> <li>Price pulled back and held the 100 EMA dynamic support zone at 1.35, forming a ZigZag low</li> <li>RSI dipped below 50 and then reversed, showing a momentum shift</li> </ul> <p><strong>Trade Execution:</strong></p> <ul> <li><strong>Entry:</strong> After ZigZag marked a higher low, entry on the first bullish candle that aligned with the RSI momentum shift (1.3570)</li> <li><strong>Stop-loss:</strong> Placed 30 pips below the most recent swing low (1.3385)</li> <li><strong>Take-profit:</strong> Price closing in RSI overbought region (1.3880)</li> </ul> <p>Using this method resulted in a gain with a risk-reward ratio of approximately 1.7x.</p> <p>This ZigZag strategy combined trend structure (from ZigZag), dynamic support (from EMA), and momentum confirmation (from RSI) to create a high-probability entry.</p> <h3>Reversal ZigZag Strategy with EMA and MACD Technical Indicators</h3> <p>This reversal trading strategy example demonstrates how to identify potential turns at major points, using CAD/JPY, which formed a double top on the daily chart.</p> <p><strong>Setup:</strong> ZigZag (20 depth, 8 deviation, 7% backsteps) + MACD</p> <p><img alt="Zig Zag Trading Strategy (ThinkMarkets)" src="/getmedia/67cebbb7-063c-4c3a-a580-2a16bdd4901b/Academy-indicators-and-patterns-zigzag-indicator-Strategy-with-EMA-and-MACD-Confirmation-CADJPY-1D-Chart-1.jpg" /></p> <p style="text-align: center;">ZigZag Strategy with EMA and MACD Confirmation, CADJPY 1D Chart</p> <p><strong>Signal:</strong></p> <ul> <li>ZigZag clearly delineated a double top formation (M pattern)</li> <li>The MACD histogram and lines turned negative, confirming a momentum shift</li> <li>The market slid below the 100 EMA to confirm a trend change from bullish to bearish</li> </ul> <p><strong>Trade Execution:</strong></p> <ul> <li><strong>Entry:</strong> Short position when the price broke below the recent ZigZag low (104.70)</li> <li><strong>Stop-loss:</strong> Placed 30 pips above the 100 EMA (106.15)</li> <li><strong>Take-profit:</strong> The height of the double top pattern projected downward from the breakout point (length of 110.50 to 104.70 from breakout point -> 98.90)</li> </ul> <p>As with the previous example, this position combined the ZigZag's ability to outline patterns, an EMA trend change and MACD momentum confirmation, resulting in a trade that offered a nearly 4x risk:reward.</p> <h2>Risk Management and Best Practices to Use ZigZag</h2> <p>While the Zig Zag indicator is often used as a trading analysis tool, it has its drawbacks.</p> <p>For starters, the indicator lags. This means that ZigZags appear some time after the price has exceeded the threshold. Relying solely on it would result in trends that have already moved substantially, which supports the idea of confirming trends.</p> <p>Another downside is how susceptible the trading tool can be to false signals or whipsaws, especially in volatile forex markets. To mitigate these effects:</p> <ul> <li><strong>Adjust Settings:</strong> Increase the deviation percentage threshold to reduce sensitivity to minor price fluctuations</li> <li><strong>Combine with Other Indicators:</strong> Use the ZigZag trading indicator with other complementary forex tools like the RSI or the MACD for confirmation</li> <li><strong>Confirm with Volume:</strong> Analyse real trading volume to confirm the strength of a trend</li> <li><strong>Use Whipsaw Filters:</strong> Use other types of indicators that help identify and filter out whipsaw patterns</li> </ul> <p>Due to these drawbacks, prudent position sizing is crucial. Traders should risk a small percentage (ideally 1-2%) of their trading capital for every position to ensure a minimal and manageable drawdown.</p> <h2>Common Trader Mistakes with the Zig Zag Indicators</h2> <p>Traders should be aware of the following mistakes when using the ZigZag indicator:</p> <ul> <li><strong>Ignoring the broader market context:</strong> Focusing exclusively on ZigZag patterns without considering the overall market trend can result in misguided trades. Always analyse the prevailing market direction alongside ZigZag signals.</li> <li><strong>Using inappropriate settings for different timeframes:</strong> Applying uniform settings across different timeframes or assets leads to inaccurate representations. Higher timeframes generally require larger deviation settings.</li> <li><strong>Failing to wait for pattern confirmation:</strong> The ZigZag indicator can redraw its lines as new price data becomes available. Acting on a pattern before it is fully formed can lead to trades based on incomplete information.</li> <li><strong>Neglecting to adjust for market conditions:</strong> Market volatility varies across different assets and timeframes. Using static ZigZag settings without adjusting for these variations can result in missed opportunities or false signals.</li> </ul> <p>Understanding the importance of avoiding these actions can help many traders make more informed live trading decisions when using the tool.</p> <h2>Conclusion</h2> <p>The Zig Zag indicator is a tool used by many traders to filter out market noise by highlighting major turning points and potential continuations in trend direction. Its visual clarity allows forex traders to analyse market structures more easily and aid in technical nature decisions.</p> <p>When applying a ZigZag trading strategy, remember these key principles:</p> <ul> <li>Use the tool as part of a complete trading system, not in isolation</li> <li>Combine its signals with momentum analysis and breakout patterns for confirmation</li> <li>Adjust settings as market conditions and volatility change</li> <li>Apply proper risk management with appropriate stops near ZigZag points</li> </ul> <p>However, whether you use the ZigZag indicator as a reversal or trend tool, or count Elliott waves, to integrate it into your trading toolbox properly, you must master both its strengths and limitations. The Zig Zag indicator does not predict the future after all.</p> <div> </div>