

 UK
UK


Table of contents
- What is technical analysis?
- What is a price chart?
- Candlestick chart
- Types of technical analysis
The most important part of any trading strategy is knowing when to enter and exit the market. In our previous trading guides and articles, we covered various factors influencing price movements in financial markets, such as economic indicators and political climate.
Analysing such factors is called fundamental analysis, and it is a very popular method to evaluate future price movements among traders.
However, some traders consider insights found with the help of fundamental analysis insufficient to provide exact buy and sell levels. That’s where technical analysis can be useful.
In this article, we’ll explain what technical analysis is, how it works, and its main types.
What is technical analysis?
Technical analysis is the process of evaluating past price movements of an instrument to determine its future moves. The reason it’s called technical is because it’s based purely on statistics and is not affected by news, economic or political factors.
While this method is widely used by traders all over the globe, it’s important to understand that past prices don’t predict or dictate future prices, and all the insights gathered with the help of technical analysis are solely indicative.
Technical analysis includes multiple tools. An experienced technical analyst usually uses various combinations of them to compare results and make an informed trading decision. These tools can be divided into three categories: trend lines, chart patterns and technical indicators.
All three analyse price charts. So whichever type you choose, the single most important thing is to learn how to read price charts.
What is a price chart?
A price chart in trading is a graphic sequence of historical prices of an instrument. Charts are at the heart of trading as they help traders to monitor the value of their current positions, analyse past price movements and get cues as to where the price may move next. Understanding how to read a price chart is a key step in learning technical analysis.
Each trading platform offers a different set of various chart types, and the choice depends purely on a trader’s personal preference. ThinkMarkets’ proprietary platform ThinkTrader, for example, has over 15 different charts to accommodate traders’ needs.
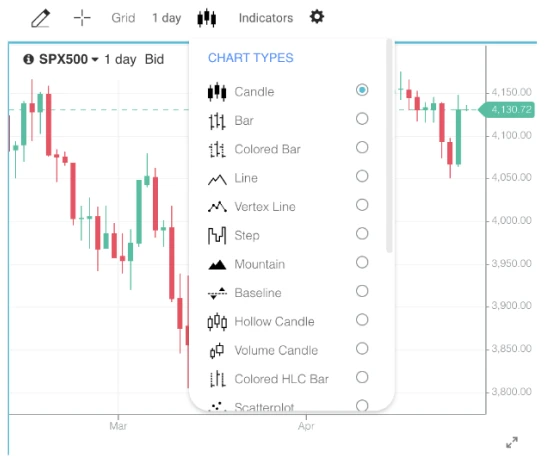
Some popular ones are candlestick, bar and line charts:
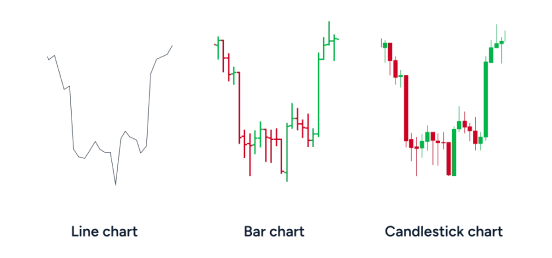
As a candlestick chart is the most commonly used by traders, let’s see how it works in detail.
Candlestick chart
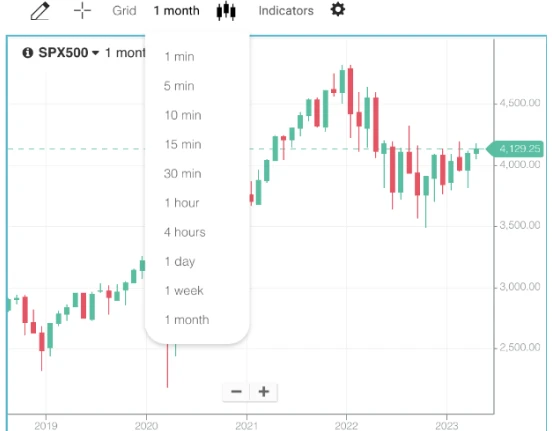
A candlestick chart is called so because each unit of it looks like a candle. The time frame of candles can be adjusted from one minute to one month, depending on the strategy:
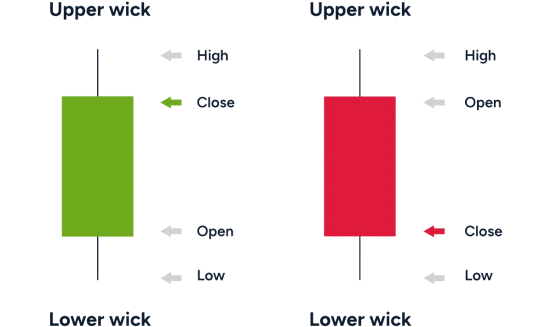
Regardless of the chosen time frame, each candle consists of two main elements: the wick and the body that represent four prices of an instrument:
- Opening price
- Highest price reached during the chosen period
- Lowest price reached during the chosen period
- Closing price
The candles are coloured depending on whether the market rose or fell during the selected timeframe. Green candles (white on some platforms) indicate rising or bullish prices, and red (black) represent falling prices, also called bearish.
In technical analysis, it is exactly the relationship between individual candlesticks that helps traders predict a future price movement.
Types of technical analysis
As we mentioned above, technical analysis tools can be segregated into three categories: trend lines, chart patterns and technical indicators.
Trend lines
Prices never move in straight lines. Influenced by many factors, they move up and down, forming highs and lows. A trend means the overall direction of the price movements. Trend lines are just straight lines that traders use to connect highs and lows on a price chart to identify a trend. Some trend lines, such as support and resistance, are used to identify an entry and exit level before opening a position.
In one of our following articles, we’ll explain how trend analysis works and how to identify a trend in detail.
Chart patterns
A chart pattern is a graphic sequence of lines that can be identified on a price chart. Chart patterns are very popular among traders as they can often signal the beginning, end, strengthening or weakening of a trend.
We’ll go through the most popular patterns in one of our next articles as well and explain how they work.
Technical indicators
Technical analysis indicators are mathematical calculations based on historical data and used to identify price action. As complex as it sounds, traders don’t need to do the actual math. Every trading platform offers technical indicators that can be simply applied to a price chart. The main goal for a trader is to learn how to read them.
Depending on their types, technical indicators can analyse trend direction and strength and identify potential entry and exit points. We will cover this topic in detail in our following articles too.
For now, to start getting familiar with technical analysis, we suggest creating a risk-free demo account on ThinkTrader and studying various price charts. You will be able to use the same platform to continue your journey with technical analysis, as it offers an extensive suite of analytical tools.


