Articles (40)
Forex Fundamental Analysis: Definition, Drivers & Trading Methodology
<p>Forex fundamental analysis is a type of analysis used in trading to gain a deeper understanding of the factors that move the foreign exchange market. Unlike technical analysis, which tells you "what" is happening, fundamental analysis in forex reveals "why" it's happening, giving you an edge in an increasingly competitive forex market.</p> <p>Did you know that 85% of chief forex dealers in London rely more on trading fundamentals than technical analysis? According to the Bank of England's study, "Charts and Fundamentals in the Foreign Exchange Market," these professional traders understand that while charts may show where the price has been, it's fundamentals that truly drive where it's going.</p> <p>Forex fundamental analysis can give you the power to see beyond <a href="/en/trading-academy/technical-analysis/day-trading-chart-patterns/">price patterns</a> by examining the underlying aspects that make up the intrinsic value of a country's currency, including economic, monetary, and capital flow factors.</p> <p>In this article, we will go through:</p> <ul> <li>The three pillars of fundamental analysis that drive the majority of significant currency movements</li> <li>How to interpret like a pro major economic indicators that affect forex markets, focusing on what truly matters</li> <li>Why do different currency types, from reserve to commodity currencies, respond to fundamentals and affect various currency groups in different ways</li> <li>Catalysts and a step-by-step methodology to transform fundamental data into forex fundamental trading strategies</li> </ul> <p>Whether you're struggling to understand sudden market moves or looking to build more conviction in your trades, mastering fundamental analysis may transform how you approach the forex market forever.</p> <div> <style type="text/css">.didyouknow { display: block; background: #F1FDf0; width: 600px; border-radius: 20px; gap: 20px; padding-top: 48px; padding-right: 40px; padding-bottom: 48px; padding-left: 40px; font-family: Figtree; font-weight: 600; font-size: 22px; line-height: 140%; letter-spacing: 0%; } </style> </div> <div style="text-align: center;"> <style type="text/css">.btn { font: Figtree; justify-content: center; align-items: center; text-align: center; gap: 7px; font-style: normal; font-size: 18px; line-height: 24px; padding: 13px 20px; border: 1px solid #ddd; border-radius: 38px; background: #5EE15A; } </style> </div> <div class="didyouknow">Ready to Dive Into Forex Fundamental Analysis?<br /> <br /> <a class="btn" href="https://portal.thinkmarkets.com/account/individual/demo/" style="text-decoration: none; font-weight: 500; color: #000000; background: 5EE15A;" target="_blank">Open a Demo and Start Testing Today!</a></div> <h2>What is Fundamental Analysis in Forex</h2> <p>A fundamental analysis definition in <a href="/en/trading-academy/forex/what-is-forex-trading/">forex</a> sees the type of analysis as the systematic evaluation of economic, financial, political, and social factors that influence currency valuations across global markets. Unlike chart analysis, fundamental analysis in forex focuses on causal relationships between economic variables and exchange rates.</p> <p>At its core, this forward-looking method examines:</p> <ol> <li><strong>Economic strength indicators:</strong> GDP growth, employment figures, inflation rates, and productivity metrics</li> <li><strong>Monetary policy dynamics:</strong> Interest rate trajectories, quantitative measures, and central bank decisions/communications</li> <li><strong>Political stability of a country:</strong> Governance quality, regulatory environment, international relations, and geopolitical positioning*</li> <li><strong>Market sentiment:</strong> Risk appetite, positioning extremes, market volatility metrics, and carry trade dynamics</li> </ol> <p>*For a deeper understanding of how geopolitics work in forex, visit our article Impact of Geopolitical Events on Forex Markets.</p> <p><img alt="Fundamentals in Forex Trading (ThinkMarkets)" src="/getmedia/6fc7f504-8e95-4b8e-a305-b24d6bbb195c/Academy-Forex-Fundamental-Analysis-4-Core-Fundamental-Analysis-Elements-in-Forex-Markets.png" /></p> <p style="text-align: center;">4 Core Fundamental Analysis Elements in Forex Markets</p> <p>Note that market sentiment is not as much a fundamental element as it is based on market psychology. It often bridges both technical and fundamental analysis, as traders often use both to form a complete market view. While fundamentals provide the underlying narrative, sentiment reflects how market participants interpret and act on this information.</p> <h3>Technical vs Fundamental Analysis</h3> <p>The key differences between fundamental and technical analysis include:</p> <ul> <li>Focuses on the "why" behind price movements rather than just "how" prices move</li> <li>Utilises macroeconomic data rather than price patterns and chart formations</li> <li>Operates across multiple timeframes with emphasis on longer-term economic cycles</li> <li>Considers inter-market relationships and global capital flows</li> </ul> <p>To learn more about technical analysis, go to our article: Technical Analysis in Forex: Definition, Charts & Strategy Method.</p> <h2>Why is Fundamental Analysis Important for Forex Traders</h2> <p>Forex fundamental analysis can help traders really understand current market conditions and spot potential trading opportunities. However, it can also assist them in various other ways. In particular, it enables forex traders:</p> <h3>1. Understand Economic Indicators and Market Catalysts</h3> <p>When changes in economic data and policy are major, they often trigger market moves so large that technical analysis alone cannot predict them. And when these major economic shifts happen, knowing the underlying economic factors driving them prevents forex traders from being blindsided by sudden price movements.</p> <h3>2. Improve Decision-Making in Trading</h3> <p>Knowledge of forex fundamentals can help traders build stronger conviction in their trading decisions and may even allow them to hold positions through market noise. By learning fundamental relationships, they can better differentiate between brief fluctuations and real trend reversals. In turn, this allows them to scale position sizes with greater confidence.</p> <h3>3. Manage Risk More Effectively</h3> <p>Forex traders can anticipate potential volatility catalysts in advance as well as identify key risk events. This helps them assess how vulnerable the market might be to surprises and protect their positions during fundamental changes.</p> <p>Knowledge of fundamental relationships enables traders to make more informed trading decisions about currency pricing in response to changing conditions.</p> <h2>The Three Pillars of Forex Fundamental Analysis</h2> <p>To start employing fundamental analysis in forex, one must first understand the three interconnected pillars that can drive the value of a currency:</p> <p><img alt="Pillars of Forex Fundamental Analysis (ThinkMarkets)" src="/getmedia/ba8486bd-6010-4415-9a3e-9d530d471633/Academy-Forex-Fundamental-Analysis-Three-Pillars-of-Fundamental-Analysis-Forex.png" /></p> <p style="text-align: center;">Three Pillars of Fundamental Analysis, Forex</p> <h3>1. Macroeconomic Performance Differentials</h3> <p>When comparing a country's economy to another, relative performance matters more than absolute values. Strong currencies typically arise from economies showing:</p> <ul> <li>Higher GDP growth rates compared to trading partners (differential of 1%+ sustained over quarters)</li> <li>Positive productivity trends signalling sustainable expansion potential</li> <li>Strong employment data showing labour market health beyond headline unemployment figures</li> <li>Stable inflation within target bands indicates economic balance</li> </ul> <p>Key economic indicators within this pillar include:</p> <ul> <li><strong>Growth differentials:</strong> Affect long-term capital allocations</li> <li><strong>Inflation differentials:</strong> Impact of currency competitiveness and long-term value</li> <li><strong>Employment trends:</strong> Signal economic health and potential policy shifts</li> <li><strong>Productivity metrics:</strong> Indicate sustainable growth potential</li> </ul> <p>For a deep dive into these indicators, refer to our previous article on <a href="/en/trading-academy/indicators-and-patterns/what-are-forex-economic-indicators-and-how-they-impact-forex/">What Are Forex Economic Indicators and How They Impact Forex Trading</a>.</p> <h3>2. Monetary Policy Divergence</h3> <p>Interest rate decisions explain much of the differential movement in developed market currencies. This pillar examines:</p> <ul> <li>Real yield differentials (nominal yields minus inflation) between currency pairs</li> <li>Central bank cutting and raising interest rates (easing/tightening) and their relative positioning</li> <li>Balance sheet policies (quantitative easing/tightening) affecting liquidity</li> <li>Forward guidance disparities signalling future policy intentions</li> </ul> <p>The central bank policy framework includes:</p> <ul> <li><strong>Reaction Function Parameters:</strong> Define policy responses to economic conditions</li> <li><strong>Dual vs. Single Mandate Prioritisation:</strong> Influences predictability of policy responses</li> <li><strong>Forward Guidance Credibility:</strong> Affects market response to communications</li> <li><strong>Quantitative Policy Impact:</strong> Influences both currency values and economic activity</li> </ul> <p><strong>Tip:</strong> The 2-year government bond yield spread between economies shows a particularly strong correlation with exchange rate movements, serving as a proxy for expected monetary policy divergence—for example, USD/JPY currency correlation with US-Japan 2-year yield spread.</p> <p><img alt="Currency Correlation (ThinkMarkets)" src="/getmedia/c6a59974-f340-4f6d-ae7e-4c0600f4bdf0/Academy-Forex-Fundamental-Analysis-High-Importance-Forex-Economic-Events-G7-ThinkMarkets-Trader-Platform-Calendar.png" /></p> <p style="text-align: center;">USD/JPY vs US-Japan 2-year spread</p> <h3>3. Capital Flow Analysis</h3> <p>This pillar examines capital movements that drive currency demand:</p> <p><strong>Capital Flow Components:</strong></p> <ul> <li>Current account balances as a percentage of GDP (surplus currencies tend to appreciate)</li> <li>Foreign direct investment patterns indicate long-term economic confidence</li> <li>Portfolio investment flows into equity and debt markets</li> <li>Foreign ownership percentages of local debt markets (early warning for EM currencies)</li> </ul> <p><strong>Key capital flow indicators within this pillar include:</strong></p> <ul> <li><strong>Current Account/GDP Ratio:</strong> Indicates fundamental currency pressure</li> <li><strong>Foreign Direct Investment Trends: </strong>Shows long-term confidence</li> <li><strong>Portfolio Flow Patterns:</strong> Reveals short-term market sentiment</li> <li><strong>External Debt Metrics</strong>: Highlights potential vulnerability to outflows</li> </ul> <p>However, specific fundamentals do not exert the same influence on currency pricing.</p> <h2>How Do Fundamentals Transmit to Currency Prices</h2> <p>The transmission from fundamentals to currency prices operates through multiple channels working simultaneously but at different velocities:</p> <p><img alt="Fundamental Drivers of Currency Pricing (ThinkMarkets)" src="/getmedia/b8e1df9c-0ff2-4e30-8c6c-0d2b56317faa/Academy-Forex-Fundamental-Analysis-Key-Transmission-Channels-of-Fundamentals-into-Currency-Prices.png" /></p> <p style="text-align: center;">Key Transmission Channels of Fundamentals into Currency Prices</p> <p><strong>Interest Rate and Capital Flow Differentials:</strong> Currencies with higher interest rates (real rates) tend to attract capital inflows, creating upward pressure on their exchange rates. Similarly, strong economic growth attracts foreign investment.</p> <p><strong>Risk Appetite Dynamics:</strong> Global uncertainty drives capital toward currencies perceived as stable stores of value, particularly the US dollar, the Swiss franc, and the Japanese yen, during market stress.</p> <p><strong>Market Expectations and Forward Pricing:</strong> Markets price currencies based on anticipated future conditions rather than current data, which explains why expected policy shifts often impact prices before they are implemented.</p> <p>These transmission mechanisms can operate across distinct timeframes:</p> <ul> <li><strong>Short-term (intraday to weekly):</strong> Data releases, central bank communications</li> <li><strong>Medium-term (weekly to monthly):</strong> Monetary policy cycles, inflation trends</li> <li><strong>Long-term (monthly to yearly):</strong> Growth differentials, structural economic changes</li> </ul> <p>Understanding these timeframes helps forex traders align their analysis horizon with their fundamental trading strategy, from news trading strategies to position trading.</p> <h3>Currency-Specific Transmission Patterns</h3> <p>Currencies are not created equal, as their pricing reflects different fundamental factors. Different currency types respond to these transmission mechanisms in distinct ways, requiring traders to tailor their analysis accordingly. There are three different types of currencies, each with its own transmission channels.</p> <h4>Reserve Currencies (USD, EUR, GBP, CHF, JPY)</h4> <p>To trade forex, one must assess global situations alongside domestic market fundamentals when it comes to reserve currencies, i.e., major currency pairs.</p> <h4>Primary Transmission Channels</h4> <ul> <li><strong>Monetary Policy:</strong> Federal Reserve decisions and Treasury yields drive USD</li> <li><strong>Safe-Haven Flows:</strong> Risk-off periods strengthen CHF and JPY</li> <li><strong>Institutional Capital Flows:</strong> Deep markets enable fast transmission</li> </ul> <p>The US dollar holds a dominant <a href="https://data.imf.org/en/news/4225global+fx+reserves+decreased+by+3+percent+in+2024q4" target="_blank">reserve status</a> (approx 60% according to the IMF), which strengthens its response to Fed policy, while the euro reflects ECB decisions across a fragmented eurozone. The Swiss franc and Japanese yen often move counter to their domestic fundamentals during periods of market stress, displaying <a href="/en/trading-academy/commodities/what-is-gold-trading-why-trade-gold/">safe-haven</a> characteristics.</p> <p>These major currencies are highly liquid and see their relative market values refreshed around the clock by constant data releases <a href="/en/trading-academy/forex/sessions/">from Sydney to New York</a>. Traders may focus on inflation and employment figures, notably the US non-farm payrolls, to mould their views on each currency’s fundamentals.</p> <h4>Commodity Currencies (AUD, NZD, CAD, NOK, RUB)</h4> <p>Analysing these currencies requires following both domestic conditions and commodity prices. For example, copper and iron ore take a significant chunk of Australia’s exports, and their prices tend to weigh on the currency.</p> <h4>Primary Transmission Channels</h4> <ul> <li><strong>Terms of Trade:</strong> Commodity price movements</li> <li><strong>Global Growth Cycles:</strong> Trade volume impact</li> <li><strong>Risk Appetite:</strong> Pro-cyclical behaviour</li> </ul> <p>These currencies show a strong correlation with their key export commodities: copper and iron ore for AUD, dairy for NZD, and oil for CAD, NOK, and RUB. Chinese economic data often drives AUD and NZD moves through its impact on commodity demand.</p> <h4>Emerging Market Currencies (CNH, CZK, HUF, PLN, ZAR)</h4> <p>They display increased sensitivity to global risk appetite and the strength of the US dollar.</p> <h4>Primary Transmission Channels</h4> <ul> <li><strong>Global Risk Sentiment:</strong> Quick transmission through capital flows</li> <li><strong>External Vulnerability Metrics:</strong> Current account and debt levels</li> <li><strong>Political Risk Premium:</strong> Institutional stability impact</li> </ul> <p>These currencies show increased sensitivity to the strength of the USD and global risk appetite, with political developments often triggering rapid capital flow responses. Central banks generally lack credibility, and let inflation run out of control, which makes these currencies particularly volatile.</p> <h2>How to Use Fundamental Analysis in Forex Trading</h2> <p>Successful fundamental analysis trading requires a systematic method for translating fundamental insights into tradeable opportunities. The following step-by-step framework may help traders and investors move from analysis to execution while maintaining disciplined risk management.</p> <h3>Step 1 - Implement Analysis Driven by Fundamental Data</h3> <p>To trade forex using fundamental analysis, one has to be able to:</p> <ul style="list-style: none;"> <li>A. Understand market reactions</li> <li>B. Implement data hierarchy</li> <li>C. Verify fundamental signals</li> </ul> <h4>A. Understand Market Reactions</h4> <p>Skilled fundamental traders who do fundamental trading know that market reactions to data releases depend more on deviations from expectations than on absolute values or technicals for that matter.</p> <p>As markets show different sensitivity to economic indicator surprises, data that exceeds certain thresholds is more meaningful in terms of risk and opportunity. Some of the thresholds that may drive outsized market repositioning are seen in the table below.</p> <p><img alt="Major Economic Reports Deviations and Impact on Currencies (ThinkMarkets)" src="/getmedia/c90fa025-a69d-4e63-b136-ce0ad39ddca7/Academy-Forex-Fundamental-Analysis-Major-Economic-Reports-Deviations-and-Impact-on-Currencies-ThinkMarkets.png" /></p> <p style="text-align: center;">Economic Release Numbers Threshold and Impact</p> <p>Note that at times, revisions may have a greater market impact than their initial releases, but novice investors and traders often overlook them.</p> <h4>B. Implement Data Hierarchy</h4> <p>Hard economic data from government statistics, including GDP, employment, inflation and trade balance, provide the most authoritative readings as they may influence central bank decisions.</p> <p>Survey data like business confidence and purchasing manager surveys offer secondary insights, while composite indices help with broader economic trends.</p> <p>Market-based fundamental indicators, such as risk reversals and institutional positioning reports, complete the hierarchy, providing real-time sentiment feedback.</p> <p>Here’s a table with what economic report data is most reliable and examples of what they can change:</p> <p><img alt="Major Forex Economic Data Reliability (ThinkMarkets)" src="/getmedia/afdd1c70-a43b-40bf-8784-9166bd404059/Academy-Forex-Fundamental-Analysis-Major-Forex-Economic-Data-Reliability-ThinkMarkets.png" /></p> <p style="text-align: center;">Which Economic Data Category is Most Reliable in Forex</p> <p>Understanding this hierarchy can help forex traders to weigh information appropriately when building positions.</p> <h4>C. Verify Fundamental Signals</h4> <p>In an attempt to raise the odds of success, fundamental analysts employ multiple verification methods in trading fundamental analysis:</p> <ul> <li>Data triangulation compares primary statistics with secondary confirmation</li> <li>Cross-verification analyses aim to align with leading economic indicators</li> <li>Cross-asset verification ensures fundamental alignment in broader financial markets</li> </ul> <h3>Step 2 - Align Fundamental and Technical Analysis</h3> <p>The alignment method helps with entry and risk management, with the fundamental part identifying the directional bias and the technical part timing entries for favourable risk-reward.</p> <p>Key support and resistance provide natural entry points when fundamental catalysts fuel volatility, and momentum indicators could confirm this narrative. Fundamental traders may prefer to pay special attention to technical breakouts that support fundamental drivers, as they may lead to sustained market trends.</p> <p>A divergence between expectations and price action may signal trend changes. When fundamentals fail to produce the expected breakouts, the market positioning may be incorrect or signal a turn.</p> <h3>Step 3 - Plan Entries based on Fundamental Catalysts</h3> <p>Catalyst-driven entries are based on specific events or data. Proper identification and execution are essential to capture alpha while managing risk.</p> <p>Clearly defined fundamental triggers set specific conditions to open a position. High-probability setups stem from large deviations from market expectations, so thresholds ensure that trades are opened only when an event is of significant importance.</p> <p>Pre-established execution parameters define exact entries ahead of events, which helps eliminate emotional decision-making in the heat of the moment. They include execution timeframes (e.g. 5 minutes post-release) and confirmation signals such as breakout candles.</p> <p>Risk-adjusted position sizing accounts for increased volatility and uncertainty surrounding trade execution. Traders may reduce their usual ticket sizes by half to offset wider spreads, slippage, and gaps.</p> <p>Liquidity considerations require traders to be aware of the market depth surrounding data releases. Spreads can widen a lot in the first minutes, and traders might want to wait for them to normalise before going in.</p> <h3>Step 4 - Determine Position Size from Fundamental Conviction</h3> <p><a href="/en/trading-academy/forex/position-sizing-guide/">Trade sizes</a> should reflect the conviction that a trader has in the fundamental narrative. Strong divergence suggests that larger positions may be opened when economic data show heavy deviations from consensus, as the market response could unwind previous positioning.</p> <p>Confirmation with multiple indicators increases the odds of a solid trade, and in turn, validates the corresponding position size. On the one hand, this prevents over-sizing on a single data point, while on the other hand, it helps with gains from the previously mentioned fundamental alignment.</p> <p>Existing market positioning should also be taken into account when adjusting the trade size, based on whether the fundamental view aligns with the prevailing market trend. If so, positions may be reduced, as favourable developments may already be reflected in the price.</p> <p>As a rule of thumb, a systematic method would set capital allocation as follows:</p> <ul> <li>0.5% risk for weak and mid-strength fundamental divergence</li> <li>1% risk for fundamental-technical alignment setups</li> <li>Up to 2% for fundamental signals confirmed by several indicators</li> </ul> <h3>Step 5 - Work Out a Fundamental Stop Loss</h3> <p>These are triggered when the underlying story becomes invalid. Traders must monitor a country's <a href="/en/trading-academy/market-events/how-to-use-the-thinkmarkets-economic-calendar/">economic calendar</a> for data, policy developments, and market conditions to determine whether fundamental assumptions remain valid. For example, a long USD position based on Fed tightening should be closed if the central bank signals a dovish stance, regardless of the price action.</p> <p>Invalidation usually takes shape gradually through several data points, and traders can set their checkpoints accordingly to spot when the tide turns. This prevents holding onto losers when the underlying condition evolves while avoiding premature exits due to market noise.</p> <h3>Step 6 - Project Target based on Fundamental Model</h3> <p>Traders can set their profit objectives based on fundamental developments, by looking at historical price data or forward-looking models.</p> <ul> <li><strong>Historical Reactions:</strong> Similar market fundamentals have set expectations based on previous events. These deja vu patterns help traders focus on targets with historical precedent.</li> <li><strong>Interest Rate Differential Trajectory:</strong> It acts as a projection of forex movements from monetary policy divergence. Forward rate curve reveals expectations for each country’s interest rate path, and an increased differential would justify larger targets.</li> </ul> <p>Using multi-timeframe analysis, traders can set targets whenever there is alignment between technical indicators and fundamental data. Short-term targets may serve as support and resistance for partial profit-taking, while longer-term targets would be part of overall position management.</p> <div> <style type="text/css">.didyouknow { display: block; background: #F1FDf0; width: 600px; border-radius: 20px; gap: 20px; padding-top: 48px; padding-right: 40px; padding-bottom: 48px; padding-left: 40px; font-family: Figtree; font-weight: 600; font-size: 22px; line-height: 140%; letter-spacing: 0%; } </style> </div> <div style="text-align: center;"> <style type="text/css">.btn { font: Figtree; justify-content: center; align-items: center; text-align: center; gap: 7px; font-style: normal; font-size: 18px; line-height: 24px; padding: 13px 20px; border: 1px solid #ddd; border-radius: 38px; background: #5EE15A; } </style> </div> <div class="didyouknow">Want to Apply this Framework in Real-Time? Open a Risk-Free Demo Account and Practice with virtual funds.<br /> <br /> <a class="btn" href="https://portal.thinkmarkets.com/account/individual/demo/" style="text-decoration: none; font-weight: 500; color: #000000; background: 5EE15A;" target="_blank">Start Demo Trading Here!</a></div> <h2>Trading Fundamentals on EURUSD: Central Bank & Interest Rate Idea</h2> <p>Below, we present a fundamental <a href="/en/trading-academy/forex/popular-forex-trading-strategies/">trading strategy</a> on EURUSD, along with a brief analysis of the step-by-step methodology.</p> <p><strong>Initial Market Context</strong></p> <ul> <li>European Central Bank (ECB) expected to deliver 4 rate cuts vs the Fed's 2 cuts in 2025</li> <li>Eurozone showing improved economic outlook</li> <li>Business activity returning to growth trajectory</li> <li>Euro finding bottom near the 1.0200 round support as market sentiment shifts</li> </ul> <p><img alt="EURUSD Fundamental Trade (ThinkMarkets)" src="/getmedia/857bb98f-f1be-4524-8c90-24af146abf6d/Academy-Forex-Fundamental-Analysis-EURUSD-Trade-based-on-ECB-Rhetoric-Shift-Fundamental-Conviction.jpg" /></p> <p style="text-align: center;">EURUSD Trade based on ECB Rhetoric Shift, Fundamental Conviction</p> <h3>Step-by-Step Fundamental Trading</h3> <h4>Step 1 - Central Bank Policy & Data Analysis</h4> <p><strong>Policy Divergence:</strong></p> <ul> <li>Market repositioning ahead of the 6 March meeting</li> <li>ECB March meeting strikes hawkish tone</li> <li>Data-dependent approach signals fewer rate cuts</li> <li>Oil and gas price peaks removing headwinds</li> </ul> <p><strong>Market Validation:</strong></p> <ul> <li>Rally sustained post-meeting</li> <li>Smart money showing conviction in euro recovery</li> <li>Cross-verification with economic indicators is positive</li> </ul> <h4>Step 2 - Technical-Fundamental Alignment</h4> <p><strong>Key Technical Signals:</strong></p> <ul> <li>Double bottom formation in February</li> <li>Breakout above 1.0950 resistance <ul> <li>Earlier short squeeze amplifying upward momentum</li> </ul> </li> <li>Price action confirming hawkish narrative</li> </ul> <h4>Step 3 - Entry Strategy</h4> <p><strong>Fundamental Catalysts:</strong></p> <ul> <li>ECB's shift to 'data-dependent' approach</li> <li>Slowdown in economy; higher rates hurt economy</li> <li>Moderation in wage growth</li> <li>Drop in inflation to 2.2%</li> </ul> <p><strong>Technical Conviction:</strong></p> <ul> <li>Three consecutive bullish candles (<a href="/en/trading-academy/technical-analysis/guide-to-day-trading-triple-candlestick-patterns/">Three White Soldiers</a>)</li> <li>No reversal pattern following post-ECB peak at 1.0950</li> <li>Shallow pullback opportunity end-of-month</li> </ul> <h4>Step 4 - Position Size</h4> <p><strong>High Conviction Setup:</strong></p> <ul> <li>Strong deviation from expectations of more cuts</li> <li>Technical breakout confirmation with a <a href="/en/trading-academy/technical-analysis/single-candlestick-patterns-a-guide-for-day-trading/">Marubozu candle</a></li> <li>Fundamental alignment with growth, wage and inflation</li> <li>Suggested allocation: Up to 2% of capital</li> </ul> <h4>Step 5 - Risk Management</h4> <p><strong>Fundamental Invalidation Points:</strong></p> <ul> <li>Disappointing growth below expectations</li> <li>Rise in wage growth or inflation data</li> <li>ECB policy or member stance reversal</li> <li>Significant geopolitical disruption affecting inflation</li> <li>Institutional positioning shift in the COT report</li> </ul> <h4>Step 6 - Profit Target</h4> <p><strong>Technical Levels:</strong></p> <ul> <li>Partial take-profit at 1.1210</li> <li>Full target at 1.1400</li> </ul> <p><strong>Fundamental Exit Signals:</strong></p> <ul> <li>Deteriorating growth outlook (2 consecutive months)</li> <li>ECB dropping 'data-dependent' language</li> <li>Forward rate curve showing increased ECB accommodation</li> </ul> <p>With an entry at the first breakout candle above 1.0950 at 1.1055, a stop loss 30 pips below the EOM swing low at 1.0700 and a first take-profit mirroring the 1.0178-1.0950 leg, the trade returned 1.88x at 1.1722.</p> <h2>Conclusion</h2> <p>Fundamental analysis is one of the building blocks for trading forex, providing the economic rationale behind prevailing trends. More specifically, macroeconomic differentials, monetary policy divergence and capital flow dictate market fluctuations.</p> <p>Success in trading fundamentals in forex requires understanding that market reactions depend more on deviations from expectations than on absolute values. Savvy traders focus on:</p> <ul> <li>Systematic evaluation of economic data relative to consensus expectations</li> <li>Cross-verification of signals across multiple data sources</li> <li>Integration of fundamental catalysts with technical confirmation</li> <li>Position sizing based on fundamental conviction strength</li> </ul> <p>Remember that forex fundamental analysis isn't as much about collecting economic data or trading economic events. It’s more about understanding the relationships between all fundamental forces and currency valuations. When combined with disciplined execution and proper risk management, this can create a sustainable edge in the forex market.</p>
ZigZag Indicator Signals, Strategies and Integration
<p>The ZigZag indicator is a technical tool used by forex traders to spot chart patterns that may have been otherwise hidden by minor price movements known as “market noise.”</p> <p>By connecting major swing highs and swing lows with trend lines, the ZigZag tool provides a clearer visual context for identifying major turning points and trend continuations. Its graphical clarity reduces trend analysis time and helps navigate through market volatility.</p> <p>Focusing only on meaningful price movements, the Zig Zag indicator is a popular trading tool among swing traders and trend traders. Incorporating the technical indicator into a ZigZag trading strategy can simplify trading analysis and help cut through market noise.</p> <p>In this short trading guide, traders will learn:</p> <ul> <li>What the ZigZag trading indicator is</li> <li>The trading signals provided by the market indicator</li> <li>Different trading strategies to use with the ZigZag</li> <li>Integrating the forex indicator with existing strategies</li> <li>Risk management and best practices</li> </ul> <p>Whether you are looking to trade trends, identify price reversals, or improve your market structure analysis, understanding the Zig Zag indicator can improve your technical trading approach and help you build a proper ZigZag trading strategy.</p> <div> <style type="text/css">.didyouknow { display: block; background: #F1FDf0; width: 600px; border-radius: 20px; gap: 20px; padding-top: 48px; padding-right: 40px; padding-bottom: 48px; padding-left: 40px; font-family: Figtree; font-weight: 600; font-size: 22px; line-height: 140%; letter-spacing: 0%; } </style> </div> <div style="text-align: center;"> <style type="text/css">.btn { font: Figtree; justify-content: center; align-items: center; text-align: center; gap: 7px; font-style: normal; font-size: 18px; line-height: 24px; padding: 13px 20px; border: 1px solid #ddd; border-radius: 38px; background: #5EE15A; } </style> </div> <div class="didyouknow">Ready to Test Your Own ZigZag Trading Strategy?<br /> <br /> <a class="btn" href="https://portal.thinkmarkets.com/account/individual/demo" style="text-decoration: none; font-weight: 500; color: #000000; background: 5EE15A;" target="_blank">Try Here!</a> <br /> <br /> No Strategy? Read Along.</div> <h2>What is the ZigZag Indicator</h2> <p>The ZigZag indicator is a technical analysis tool that connects swing highs and swing lows with straight lines to filter out price moves that exceed a certain threshold.</p> <p><img alt="ZigZag Indicator - ThinkMarkets" src="/getmedia/91bf11cd-9ff2-42d2-8eea-683b68778ef3/Academy-indicators-and-patterns-zigzag-indicator-Formation-of-ZigZag-Straight-Lines.png" /></p> <p style="text-align: center;">Formation of ZigZag Straight Lines</p> <p>While primarily a lagging indicator due to plotting Ziz Zag lines after price action exceeds this threshold, when these pivot points are confirmed (i.e. when the Zig Zag line is plotted), they serve as a powerful leading trend indicator of potential future price continuation.</p> <p>Besides allowing traders to anticipate trend continuation as well as reversal patterns, it boasts advantages over similar trader tools like the Parabolic SAR or the Renko charts:</p> <ul> <li>It focuses on the magnitude of price changes, not on time intervals, which makes it more <strong>effective at identifying major market shifts</strong></li> <li>It maintains the visual context and <a href="/en/trading-academy/technical-analysis/single-candlestick-patterns-a-guide-for-day-trading/">candlestick information</a> of price charts while still filtering noise, which <strong>allows concurrent chart pattern analysis</strong></li> </ul> <p>The Zig Zag indicator helps <a href="/en/trading-academy/forex/">forex traders</a> in several other ways, starting with decluttering their view by highlighting cleaner price patterns while also revealing the underlying market structure and the direction of the trend.</p> <p>Notably, the Zig Zag indicator can assist with recognising parts of harmonics, Elliott waves and several geometry-based <a href="/en/trading-academy/technical-analysis/day-trading-chart-patterns/">chart patterns</a> due to how it marks pivot points. The term ‘Zig Zag’ itself is used extensively with the Elliott Wave Theory to pinpoint corrective wave structures.</p> <p>This combination creates a strong framework for both forex trend analysis and tactical trade execution, which brings us to the importance of understanding how the Zig Zag tool works.</p> <h2>How the Zig Zag Indicator Works</h2> <p>The Zig Zag indicator works by identifying major swing highs or swing lows on price charts based on a defined percentage threshold or deviation set by the user.</p> <p>Once the price movement exceeds this threshold from the previous turning point, the forex <a href="/en/trading-academy/indicators-and-patterns/technical-indicators-beginners-guide/">technical indicator</a> draws a straight trendline connecting these two points. This process continues with each new qualifying pivot point.</p> <p>Here is how this looks on ThinkMarkets GBPUSD 1-day chart on TradingView:</p> <p><img alt="Zig Zag Indicator (ThinkMarkets)" src="/getmedia/5a49526d-cfce-459b-9308-8d96ec70df07/Academy-indicators-and-patterns-zigzag-indicator-on-GBPUSD-1D-chart-ThinkMarkets-TradingView.jpg" /></p> <p style="text-align: center;">Zig Zag Indicator on GBPUSD 1D chart, ThinkMarkets TradingView</p> <p>Naturally, as a technical indicator in trading, the ZigZag can achieve this by a mathematical function - i.e. a formula.</p> <h3>Zig Zag Indicator Highs and Lows Formula</h3> <p>Below is the formula of how the ZigZag indicator calculates when to plot its lines:</p> <p style="text-align: center;"><strong>ZigZag (HL, %change=X, retrace=FALSE, LastExtreme=TRUE)</strong></p> <p style="text-align: center;"><strong>If %change>=X,plot ZigZag</strong></p> <p><strong>Where,</strong></p> <ul> <li><strong>HL</strong> = High/Low price series or closing price series</li> <li><strong>%change</strong> = Minimum price movement, in percentage</li> <li><strong>Retrace</strong> = Answers if change is a retracement of the previous move or an absolute change from peak to trough</li> <li><strong>Last Extreme</strong> = Answers if the extreme price is the same over multiple periods, is the extreme price the first or last observation</li> </ul> <p>The user has control of how the indicator plots ZigZag lines through its settings.</p> <h3>Zig Zag Indicator Settings</h3> <p>The ZigZag indicator has three primary settings:</p> <ol> <li><strong>Depth:</strong> Ensures swing points are major by setting a minimum number of candles</li> <li><strong>Deviation:</strong> Controls the magnitude of price movement required to plot a ZigZag</li> <li><strong>Backstep:</strong> Prevents successive pivot points from being plotted too close together</li> </ol> <p><img alt="ZigZag Indicator Default Settings (ThinkMarkets)" src="/getmedia/a0493442-2995-4046-9d8f-715a37fefbc7/Academy-indicators-and-patterns-zigzag-indicator-Settings-on-GBPUSD-1D-chart-ThinkMarkets-TradingView.jpg" /></p> <p style="text-align: center;">Zig Zag Indicator Settings on GBPUSD 1D chart, ThinkMarkets TradingView</p> <p>Each component of the ZigZag trading indicator functions differently, implying a particular impact during trading.</p> <p>Next is a summary of the ZigZag settings, what each component does and how changing settings can impact trading.</p> <p><img alt="Zig Zag Indicator Trading Signals (ThinkMarkets)" src="/getmedia/6913c198-8c6b-4534-b770-eef0099e6fb8/Academy-indicators-and-patterns-zigzag-indicator-Trading-Signals-ThinkMarkets.png" /></p> <p style="text-align: center;">Zig Zag Indicator Components and How They Function</p> <p>The deviation is a key parameter in the Zig Zag indicator's formula, as it is mainly responsible for how sensitive the indicator is. Generally, the accepted range is 5-15%, where the higher the figure is, the less sensitive the indicator is, which results in filtering out more noise.</p> <p>As a point of reference, scalpers and day traders could aim for 3-5%; in swing trading, traders may target 5-8%; long-term or position traders may opt for 10-15%. However, slight adjustments should be considered in the dynamic forex markets based on the trading session and the forex pair one trades.</p> <h2>What Are the Main Trading Signals of the ZigZag Indicator</h2> <p>The ZigZag indicator provides traders with objective signals by identifying significant price movements and filtering out minor fluctuations. These signals are not direct buy or sell recommendations but rather tools to interpret market structure and plan trades.</p> <p>The Zigzag trading indicator generates three actionable signals (with insights), acting as a trend reversal and trend trading indicator:</p> <ol> <li><strong>Trend reversals</strong> at major swing highs and lows</li> <li><strong>Trend continuations</strong> based on the direction of the ZigZag lines</li> <li><strong>Trend momentum</strong> gauged by length and angle of the ZigZag lines (used when trend trading)</li> </ol> <p>Let us take a closer look at each one separately.</p> <h3>1. Zig-Zag Indicator Trend Reversal</h3> <p>The ZigZag pivot points mark significant reversal points, often aligning with key support and resistance levels. Traders can use pivot points to set stop-loss or profit-taking levels below swing lows (for long trades) or above swing highs (for short trades).</p> <p><img alt="ZigZag Trend Reversal Trade (ThinkMarkets)" src="/getmedia/fc2af4e6-e8e7-40bc-ba03-45a385c4da74/Academy-indicators-and-patterns-zigzag-indicator-Major-Trend-Reversal-Example-GBPUSD-1D-Chart-1.jpg" /></p> <p style="text-align: center;">Major Trend Reversal Example, GBPUSD 1D Chart</p> <p>For intermediate traders, the structures that form at swing highs and lows can be used to make Elliott wave patterns or harmonic patterns easier to identify.</p> <p>On the advanced patterns front, when similar Zig Zag patterns appear, it suggests market rhythm or symmetry, which can be used to inform speculation about future price movements.</p> <h3>2. Zig-Zag Indicator Trend Continuation</h3> <p>The ZigZag reveals a clear market structure by showing higher highs and higher lows in uptrends or lower highs and lower lows in downtrends, confirming the prevailing trend direction. This implies it can be used as a trend following indicator.</p> <p>Notably, when a new ZigZag pivot forms, it signals that the price has reversed by the specified percentage threshold, which can be used as a trend confirmation signal at early turning points. Naturally, the pivot points act as breakout zones in trend continuations.</p> <p><img alt="ZigZag Trend Continuation Trade (ThinkMarkets)" src="/getmedia/c9bede24-f5f0-4457-9622-7e87915be309/Academy-indicators-and-patterns-zigzag-indicator-Trend-Reversal-Turns-into-Trend-Continuation-GBPUSD-1D-Chart-1.jpg" /></p> <p style="text-align: center;">Trend Reversal Turns into Trend Continuation, GBPUSD 1D Chart</p> <h3>3. Zig-Zag Indicator Trend Momentum</h3> <p>Longer ZigZag lines indicate stronger momentum, and shorter consolidation or trend exhaustion. On the other hand, steeper angles suggest strong momentum, while flatter angles may indicate trend exhaustion or reversal potential.</p> <p>In the GBPUSD 1D example below, an angle of 70.68 produced a 420 pips whereas an angle of 73.12 produced 727 pips, nearly twice.</p> <p><img alt="ZigZag Trend Momentum (ThinkMarkets)" src="/getmedia/e91552df-fd77-4a35-8cb0-f28fa3dda957/Academy-indicators-and-patterns-zigzag-indicator-Steeper-Angle-Produces-More-Gains-GBPUSD-1D-Chart-1.jpg" /></p> <p style="text-align: center;">ZigZag Steeper Angle Produces More Gains, GBPUSD 1D Chart</p> <p>The ZigZag length and angle also simplify the process of measuring the required Fibonacci retracement and extension levels. This aids in timing trades.</p> <p>For example, a 10% ZigZag pattern on a weekly chart can reveal the overall trend, while smaller settings, such as 5% on daily charts or 3% on 4-hour charts, may help traders identify shorter-term moves and refine entries.</p> <h2>Examples of ZigZag Trading Strategies</h2> <p>Building on our understanding of the ZigZag trading indicator signals, let us explore two practical trading strategies designed to capitalise on reversals and continuations (with momentum confirmation).</p> <h3>Swing Reversal ZigZag Trading Strategy</h3> <p>Here, traders use the indicator to clearly identify swing highs and swing lows, then trade reversals at those points when confirmed by other indicators or <a href="/en/trading-academy/forex/using-candlestick-patterns-in-forex-day-trading/">candlestick patterns</a>.</p> <p>This ZigZag strategy works best in ranging markets or at the potential end of extended trends, where a reversal is more likely.</p> <p><strong>How It Works:</strong></p> <ul> <li><strong>Identify a Significant Pivot Point:</strong> Wait for the ZigZag to mark a swing low or swing high (visible V-shape and inverted V-shape patterns that often appear in <a href="/en/trading-academy/technical-analysis/what-is-the-dead-cat-bounce-pattern-and-how-to-identify-it/">Dead Cat Bounces</a>).</li> <li><strong>Confirm the Reversal:</strong> Look for confirmation signals such as: <ul> <li>Bullish candlestick patterns (hammer, <a href="/en/trading-academy/technical-analysis/using-double-candlestick-patterns-in-day-trading/">engulfing</a>) at swing lows</li> <li>Bearish candlestick patterns (shooting star, engulfing) at swing highs</li> <li>RSI showing oversold conditions (below 30) at swing lows or overbought (above 70) at swing highs</li> </ul> </li> <li><strong>Execute the Trade:</strong> <ul> <li><strong>For long trades:</strong> Enter after confirmation near the swing low</li> <li><strong>For short trades:</strong> Enter after confirmation near the swing high</li> <li>Set stop-loss just below the recent swing low (for longs) or above the swing high (for shorts)</li> <li>Initially, target the previous swing point, the RSI overbought/oversold</li> </ul> </li> <li><strong>Manage the Position:</strong> <ul> <li>Consider partial profit-taking at the halfway point to the target</li> <li>Trail stops as price moves favorably to lock in profits</li> </ul> </li> </ul> <p>In the GBPUSD 1D long example below, using this method resulted in a gain with a risk-reward ratio of approximately 2x:</p> <ul> <li><strong>Take Profit:</strong> when the RSI closes in the overbought region near 1.29</li> <li><strong>Stop loss:</strong> 30 pips below the last ZigZag swing, measured near 1.22</li> </ul> <p><img alt="ZigZag Trend Trade (ThinkMarkets)" src="/getmedia/beb3f04d-0907-4a03-8569-99fd5f525102/Academy-indicators-and-patterns-zigzag-indicator-RSI-Reversal-Long-Trade-with-Trend-Confirmation-GBPUSD-1D-Chart-1.jpg" /></p> <p style="text-align: center;">ZigZag RSI Reversal (Long) Trade with Trend Confirmation, GBPUSD 1D Chart</p> <h3>Trend Following ZigZag Trading Strategy</h3> <p>This strategy combines the ZigZag's trend signal with trendline analysis to capture continuation moves after pullbacks. It works best in trending markets with regular pullbacks, particularly effective on daily and 4-hour charts.</p> <p><strong>How It Works:</strong></p> <ul> <li><strong>Identify the Dominant Trend:</strong> Use this indicator to confirm higher highs and higher lows (uptrend) or lower highs and lower lows (downtrend).</li> <li><strong>Draw Trendlines:</strong> Connect consecutive ZigZag swing highs (for downtrends) or swing lows (for uptrends).</li> <li><strong>Wait for a Pullback:</strong> Look for a counter-trend move that pulls back to the ZigZag lines or forms a new ZigZag leg against the trend.</li> <li><strong>Enter on Continuation Confirmation:</strong> <ul> <li><strong>For uptrends:</strong> Enter long when price bounces off trendline support or breaks above a minor high</li> <li><strong>For downtrends:</strong> Enter short when price rejects from trendline resistance or breaks below a minor low</li> <li>Confirm with volume increase or momentum indicator alignment (MACD crossover)</li> <li>Place a stop-loss beyond the most recent counter-trend ZigZag pivot</li> </ul> </li> <li><strong>Monitor Zigzag Momentum Signals:</strong> <ul> <li>Watch for ZigZag line characteristics during the trade</li> <li><strong>Strong momentum:</strong> long ZigZag legs with steep angles in trend direction</li> <li><strong>Weakening momentum:</strong> shorter ZigZag legs with flatter angles</li> <li><strong>Warning sign:</strong> counter-trend ZigZag moves deepening beyond 50% retracement</li> </ul> </li> <li><strong>Take Profit Approaches:</strong> <ul> <li>Use Fibonacci extensions (127.2% or 161.8%) of the pullback move</li> <li>Target the length of the previous ZigZag leg in the trend direction</li> <li>Implement a trailing stop based on subsequent ZigZag pivots</li> <li>Consider scaling out when ZigZag momentum shows signs of weakening</li> </ul> </li> </ul> <p>In the GBPUSD 1D short example below, using this method resulted in a gain with a risk-reward ratio of approximately 2x:</p> <ul> <li><strong>Take Profit:</strong> at 161.8% of the prior major Zig Zag near 1.21</li> <li><strong>Stop loss:</strong> 30 pips above the last ZigZag swing, measured near 1.3070</li> </ul> <p><img alt="Zig Zag Trend Trade (ThinkMarkets)" src="/getmedia/2ee9b913-9226-4886-809f-50ca2c4203cb/Academy-indicators-and-patterns-zigzag-indicator-Trend-Continuation-Short-Trade-with-MACD-Confirmation-GBPUSD-1D-Chart-1.jpg" /></p> <p style="text-align: center;">Zig Zag Trend Continuation (Short) Trade with MACD Confirmation, GBPUSD 1D Chart</p> <p>By keeping a close eye on the length, angle, and pattern of ZigZag lines throughout a trade, traders can manage their positions more effectively, hold through periods of strong momentum and reduce exposure when momentum begins to wane.</p> <h3>Additional ZigZag Trading Strategies</h3> <p>Beyond these three core strategies, traders often implement several other ZigZag-based approaches:</p> <ol> <li><strong>Fibonacci Confluence Strategy:</strong> Uses ZigZag pivot points as anchors for Fibonacci retracement and extension levels to identify precise entry and exit points during trends.</li> <li><strong>ZigZag Channel Trading:</strong> Forms price channels by connecting consecutive ZigZag swing highs and lows, then trades bounces within the channel or breakouts from it.</li> <li><strong>Pattern Recognition Strategy:</strong> Uses the ZigZag to more clearly visualise classic chart patterns like double top and double bottom patterns, head and shoulders, or <a href="/en/trading-academy/technical-analysis/using-double-candlestick-patterns-in-day-trading/">triangles</a> that might be obscured in noisy price action.</li> <li><strong>Elliott Wave Analysis:</strong> Leverages the ZigZag's filtering capability to more accurately count waves and identify potential market reversals.</li> </ol> <p>Each of those ZigZag trading strategies can be adjusted based on trading style, risk tolerance, and the markets one trades.</p> <h2>How to Use the Zig Zag Indicator In A Strategy</h2> <p>The process of integrating the ZigZag trading indicator into a trading strategy involves the following steps:</p> <p><strong>Step 1 - Select the Indicator:</strong> Add the Zigzag from the indicator list.</p> <p><strong>Step 2 - Set Initial Parameters:</strong> Set the deviation at a 5% threshold for a balanced view (or use trading platform default settings).</p> <p><strong>Step 3 - Adjust Visual Properties:</strong> Adjust visuals; line colour, thickness, and style for clear chart reading.</p> <p><strong>Step 4 - Fine-Tune Settings:</strong> Adjust depth, deviation, and backstep parameters according to your target market and timeframe.</p> <p><strong>Step 5 - Analyse Price Structure:</strong> Monitor how the indicator connects recent highs and lows, focus on swing patterns, trend direction and potential reversal zones, and pay attention to ZigZag characteristics (length, angle, pattern) that may suggest trend continuation or exhaustion.</p> <p><strong>Step 6 - Plan Your Trade:</strong> Align entries with additional confirmation tools, such as support/resistance levels, momentum indicators, or candlestick patterns. Set logical stop-loss levels near recent ZigZag pivots and determine take-profit targets based on previous ZigZag waves or Fibonacci levels.</p> <p>A part of integrating the ZigZag into a trading strategy, as revealed in step 4, is adjusting its settings based on the forex pair one trades.</p> <h2>Adjusting Settings for Different Forex Markets</h2> <p>This allows traders to align the forex trading indicator with their own volatility levels and price behaviour.</p> <p>Here are examples of settings to use for all three pair types (of course, one can create their own), along with the rationale behind the changes:</p> <p><img alt="ZigZag Indicator Forex Settings (ThinkMarkets)" src="/getmedia/96d3bde3-890c-4b60-967d-5aa7fd952d45/Academy-indicators-and-patterns-zigzag-indicator-Forex-Settings-ThinkMarkets.png" /></p> <p style="text-align: center;">Adjusting ZigZag Indicator Settings for Forex</p> <p><strong>Major pairs:</strong> Less volatile, highly liquid markets require moderate settings to identify meaningful swings without excessive filtering. The backstep ensures the indicator doesn’t plot two swing highs or lows too close together, which keeps the structure of the ZigZag lines clear and readable.</p> <p><strong>Cross pairs:</strong> Higher volatility needs slightly increased thresholds to filter minor price fluctuations. Slightly higher settings smooth out market noise while maintaining responsiveness.</p> <p><strong>Exotic pairs:</strong> Extreme volatility requires more aggressive filtering to identify truly significant price movements. Wider ZigZag parameters help the indicator identify only significant turning points in these unpredictable markets.</p> <p>Naturally, another consideration for integrating the ZigZag into a strategy is the timeframes.</p> <h3>Timeframe Considerations</h3> <p>Different timeframes serve distinct trading objectives when using the ZigZag indicator:</p> <ul> <li><strong>Lower timeframes (15M-1H):</strong> The indicator can be used with tighter settings for intraday trading, though they contain more noise</li> <li><strong>4-Hour charts:</strong> Provide frequent trading opportunities while maintaining reasonable signal reliability</li> <li><strong>Daily charts:</strong> Offer excellent balance between signal quality and timeliness for most ZigZag strategies</li> <li><strong>Weekly charts:</strong> Ideal for identifying major trend changes and suited for position trading</li> </ul> <p>Swing traders typically find the 4H and daily timeframes most effective, while position traders benefit from weekly chart analysis. For a comprehensive approach, consider using multiple timeframes with coordinated ZigZag settings to confirm reversal and trend signals across different time perspectives.</p> <div> <style type="text/css">.didyouknow { display: block; background: #F1FDf0; width: 600px; border-radius: 20px; gap: 20px; padding-top: 48px; padding-right: 40px; padding-bottom: 48px; padding-left: 40px; font-family: Figtree; font-weight: 600; font-size: 22px; line-height: 140%; letter-spacing: 0%; } </style> </div> <div style="text-align: center;"> <style type="text/css">.btn { font: Figtree; justify-content: center; align-items: center; text-align: center; gap: 7px; font-style: normal; font-size: 18px; line-height: 24px; padding: 13px 20px; border: 1px solid #ddd; border-radius: 38px; background: #5EE15A; } </style> </div> <div class="didyouknow">Test Your Forex ZigZag Strategy on ThinkMarkets TradingView<br /> <br /> <a class="btn" href="https://portal.thinkmarkets.com/account/individual/demo" style="text-decoration: none; font-weight: 500; color: #000000; background: 5EE15A;" target="_blank">Here!</a></div> <h2>Integrating the ZigZag Trading Indicator into Your Strategy</h2> <p>To demonstrate how to integrate the ZigZag trading indicator into your trading strategy effectively, let us examine a couple of key application scenarios.</p> <h3>Trend-Following ZigZag Strategy with EMA and RSI Technical Indicators</h3> <p>This example shows how to use the ZigZag indicator to improve a classic trend following strategy on the USDCAD 1D chart, using the <a href="/en/trading-academy/indicators-and-patterns/rsi-indicator/">Relative Strength Index</a> (RSI) and the Exponential Moving Average (EMA).</p> <p>Setup: ZigZag (14 depth, 5% deviation, 5 backsteps) + 100 EMA + RSI (14)</p> <p><img alt="ZigZag Trading Strategy (ThinkMarkets)" src="/getmedia/4ebea59f-47e0-40c6-92ae-5b4aeafb314c/Academy-indicators-and-patterns-zigzag-indicator-Strategy-with-EMA-and-RSI-Confirmation-USDCAD-1D-Chart-1.jpg" /></p> <p style="text-align: center;">Zig Zag Strategy with EMA and RSI Confirmation, USDCAD 1D Chart</p> <p><strong>Signal:</strong></p> <ul> <li>ZigZag confirmed a higher high and higher low, validating the uptrend</li> <li>Price pulled back and held the 100 EMA dynamic support zone at 1.35, forming a ZigZag low</li> <li>RSI dipped below 50 and then reversed, showing a momentum shift</li> </ul> <p><strong>Trade Execution:</strong></p> <ul> <li><strong>Entry:</strong> After ZigZag marked a higher low, entry on the first bullish candle that aligned with the RSI momentum shift (1.3570)</li> <li><strong>Stop-loss:</strong> Placed 30 pips below the most recent swing low (1.3385)</li> <li><strong>Take-profit:</strong> Price closing in RSI overbought region (1.3880)</li> </ul> <p>Using this method resulted in a gain with a risk-reward ratio of approximately 1.7x.</p> <p>This ZigZag strategy combined trend structure (from ZigZag), dynamic support (from EMA), and momentum confirmation (from RSI) to create a high-probability entry.</p> <h3>Reversal ZigZag Strategy with EMA and MACD Technical Indicators</h3> <p>This reversal trading strategy example demonstrates how to identify potential turns at major points, using CAD/JPY, which formed a double top on the daily chart.</p> <p><strong>Setup:</strong> ZigZag (20 depth, 8 deviation, 7% backsteps) + MACD</p> <p><img alt="Zig Zag Trading Strategy (ThinkMarkets)" src="/getmedia/67cebbb7-063c-4c3a-a580-2a16bdd4901b/Academy-indicators-and-patterns-zigzag-indicator-Strategy-with-EMA-and-MACD-Confirmation-CADJPY-1D-Chart-1.jpg" /></p> <p style="text-align: center;">ZigZag Strategy with EMA and MACD Confirmation, CADJPY 1D Chart</p> <p><strong>Signal:</strong></p> <ul> <li>ZigZag clearly delineated a double top formation (M pattern)</li> <li>The MACD histogram and lines turned negative, confirming a momentum shift</li> <li>The market slid below the 100 EMA to confirm a trend change from bullish to bearish</li> </ul> <p><strong>Trade Execution:</strong></p> <ul> <li><strong>Entry:</strong> Short position when the price broke below the recent ZigZag low (104.70)</li> <li><strong>Stop-loss:</strong> Placed 30 pips above the 100 EMA (106.15)</li> <li><strong>Take-profit:</strong> The height of the double top pattern projected downward from the breakout point (length of 110.50 to 104.70 from breakout point -> 98.90)</li> </ul> <p>As with the previous example, this position combined the ZigZag's ability to outline patterns, an EMA trend change and MACD momentum confirmation, resulting in a trade that offered a nearly 4x risk:reward.</p> <h2>Risk Management and Best Practices to Use ZigZag</h2> <p>While the Zig Zag indicator is often used as a trading analysis tool, it has its drawbacks.</p> <p>For starters, the indicator lags. This means that ZigZags appear some time after the price has exceeded the threshold. Relying solely on it would result in trends that have already moved substantially, which supports the idea of confirming trends.</p> <p>Another downside is how susceptible the trading tool can be to false signals or whipsaws, especially in volatile forex markets. To mitigate these effects:</p> <ul> <li><strong>Adjust Settings:</strong> Increase the deviation percentage threshold to reduce sensitivity to minor price fluctuations</li> <li><strong>Combine with Other Indicators:</strong> Use the ZigZag trading indicator with other complementary forex tools like the RSI or the MACD for confirmation</li> <li><strong>Confirm with Volume:</strong> Analyse real trading volume to confirm the strength of a trend</li> <li><strong>Use Whipsaw Filters:</strong> Use other types of indicators that help identify and filter out whipsaw patterns</li> </ul> <p>Due to these drawbacks, prudent position sizing is crucial. Traders should risk a small percentage (ideally 1-2%) of their trading capital for every position to ensure a minimal and manageable drawdown.</p> <h2>Common Trader Mistakes with the Zig Zag Indicators</h2> <p>Traders should be aware of the following mistakes when using the ZigZag indicator:</p> <ul> <li><strong>Ignoring the broader market context:</strong> Focusing exclusively on ZigZag patterns without considering the overall market trend can result in misguided trades. Always analyse the prevailing market direction alongside ZigZag signals.</li> <li><strong>Using inappropriate settings for different timeframes:</strong> Applying uniform settings across different timeframes or assets leads to inaccurate representations. Higher timeframes generally require larger deviation settings.</li> <li><strong>Failing to wait for pattern confirmation:</strong> The ZigZag indicator can redraw its lines as new price data becomes available. Acting on a pattern before it is fully formed can lead to trades based on incomplete information.</li> <li><strong>Neglecting to adjust for market conditions:</strong> Market volatility varies across different assets and timeframes. Using static ZigZag settings without adjusting for these variations can result in missed opportunities or false signals.</li> </ul> <p>Understanding the importance of avoiding these actions can help many traders make more informed live trading decisions when using the tool.</p> <h2>Conclusion</h2> <p>The Zig Zag indicator is a tool used by many traders to filter out market noise by highlighting major turning points and potential continuations in trend direction. Its visual clarity allows forex traders to analyse market structures more easily and aid in technical nature decisions.</p> <p>When applying a ZigZag trading strategy, remember these key principles:</p> <ul> <li>Use the tool as part of a complete trading system, not in isolation</li> <li>Combine its signals with momentum analysis and breakout patterns for confirmation</li> <li>Adjust settings as market conditions and volatility change</li> <li>Apply proper risk management with appropriate stops near ZigZag points</li> </ul> <p>However, whether you use the ZigZag indicator as a reversal or trend tool, or count Elliott waves, to integrate it into your trading toolbox properly, you must master both its strengths and limitations. The Zig Zag indicator does not predict the future after all.</p> <div> </div>
Trading Cup and Handle Patterns in Forex Markets
<p>Trading Cup and Handle patterns requires forex traders to understand specific nuances and effectively separate high-probability setups from low-probability setups. Thomas Bulkowski showed in his extensive study of the bullish continuation pattern that the difference between profitable and losing trades lies in the execution of a Cup and Handle trading strategy.</p> <p>Bulkowski confirmed a staggering 95% success rate in Cup and Handle trading when applying particular technical analysis criteria during bullish trends. Yet, he also proved that to achieve high success rates, traders must master tested entry and exit rules.</p> <p>Building on the <a href="/en/trading-academy/technical-analysis/cup-and-handle-pattern-for-forex-trading/">Cup and Handle chart pattern recognition</a> fundamentals covered in our previous guide, this strategy-focused article will shed some light on practical trading approaches by exploring:</p> <ul> <li>Criteria for identifying the strongest Cup and Handle formations</li> <li>Volume analysis techniques that validate pattern strength</li> <li>Specific entry signals, stop placement methods, and target-setting approaches</li> <li>Position sizing formulas calibrated for Cup and Handle trades</li> <li>A Cup and Handle strategy example with real market application</li> <li>Adjustments for trading the pattern across forex market environments</li> </ul> <p>By the end of this article, traders should possess a complete Cup and Handle trading strategy ready for immediate application in the forex markets.</p> <h2>Why Trade Cup and Handles in Forex</h2> <p>The Cup and Handle trading pattern offers forex traders specific advantages when applied to the 24/5 market environment. Its characteristics align well with currency trading dynamics for four main reasons:</p> <ol> <li>Aligns with forex market dynamics</li> <li>Presents clear trading levels to trade of</li> <li>Used in many periods, trading styles</li> <li>Its success is verified by backtests</li> </ol> <p>Let’s dive into each one of these reasons individually and evaluate how these reasons can specifically benefit traders:</p> <h3>Cup Pattern Aligns with Forex Market Technical Analysis</h3> <p>The forex market creates distinguishable breakout patterns 24/5, making Cup and Handle technical analysis more relevant:</p> <ul> <li>The consolidating nature of the Cup & Handle pattern fits well with the volatility cycles witnessed during each forex session</li> <li>Major forex pairs create smoother, more reliable U-shaped cups than the stock markets that Bulkowski analysed</li> <li>Currency trends tend to last longer due to macroeconomic factors, which can extend trend continuations following Cup and Handle pattern breakouts</li> </ul> <h3>Trading Pattern Forms Clear Risk Management Points</h3> <p>The bullish continuation pattern offers clear technical levels for trade management in a market where risk control is essential:</p> <ul> <li><strong>Cup and Handle Pattern Entry:</strong> Clear Cup and Handle breakout points minimise subjectivity</li> <li><strong>Cup and Handle Stop-Loss:</strong> Defined points below the handle or cup structure provide protection during overnight gaps</li> <li><strong>Cup and Handle Take-Profit:</strong> Objective measurement techniques create realistic Cup and Handle pattern targets</li> </ul> <h3>Traders Use Multiple Cup and Handle Pattern Time Frames</h3> <p>Unlike many breakout patterns that work only on specific timeframes, the Cup and Handle suits various forex trading styles:</p> <ul> <li><a href="/en/trading-academy/forex/day-trade/">Intraday:</a> Forms effectively on 15-minute to 1-hour charts for day traders</li> <li><strong>Swing:</strong> 4-hour chart formations provide multi-day opportunities</li> <li><strong>Position:</strong> Daily and weekly patterns signal major trend resumptions for longer-term forex positioning</li> </ul> <p>However, note that Bulkowski did not study patterns that take less than 7 weeks to form.</p> <h3>Cup and Handle Chart Patterns Are Backtested</h3> <p>When adapted for currency markets, the bullish pattern and the inverse Cup and Handle variation can maintain a strong statistical performance:</p> <ul> <li>Performance backtests suggest higher success rates on major pairs than crosses or exotics</li> <li>Pattern may perform best during specific forex sessions (London and London-NY overlap)</li> <li>Volume confirmation techniques can be adapted for the decentralised forex market</li> </ul> <p>By understanding the main reasons for trading the Cup and Handle chart pattern, traders can move beyond pattern recognition and deploy a contextually appropriate identification framework for forex. We did lay out the complete stages of the Cup and Handle formation in our first article, but here we go into specific characteristics and how trading volume can help spot the best formations.</p> <h2>How to Find the Best Cup and Handle Setups in Forex Trading</h2> <p>Transforming the pattern recognition process we laid out in our first article into a trading Cup and Handle strategy requires a systematic approach for filtering the right setups. Based on extensive pattern research and forex trading dynamics, the following 3-prong framework helps identify the highest-probability trading opportunities:</p> <h3>1. Cup with Handle Pattern Quality Classification</h3> <p>Not all Cup and Handle chart patterns are created equal. To focus only on the most promising setups, one must evaluate the Cup and the Handle separately.</p> <h4>A) Cup Formation Quality</h4> <p><img alt="Best Trading Cup and Handle Pattern, Cup Formation (ThinkMarkets)" src="/getmedia/b1684cce-b222-43de-8731-e5b11e83dc2e/Academy-Tech-analysis-Cup-and-Handle-T-Optimal-Cup-Formation-Characteristics.png" /></p> <p style="text-align: center;">Optimal Cup Formation Characteristics</p> <p><img alt="Best Trading Cup and Handle Pattern, Handle Formation (ThinkMarkets)" src="/getmedia/db3bc99b-2172-4829-8d33-68b2c5ba607f/Academy-Tech-analysis-Cup-and-Handle-T-Optimal-Handle-Formation-Characteristics.png" /></p> <p style="text-align: center;">Optimal Handle Formation Characteristics</p> <h3>2. Cup and Handle Volume Analysis</h3> <p>While gaining proper trading volume data in forex is challenging (given the market's decentralised nature), traders must perform the best analysis possible when validating the Cup and Handle chart pattern through the different formation stages we covered in our introductory article.</p> <h4>Volume During Stage 1: Formation of the Pre-Cup High</h4> <p><strong>Uptrend Volume:</strong> Look for increasing trading volume during the late uptrend before the left cup lip forms</p> <p><strong>Distribution Warning:</strong> Volume that peaks before price reaches its high (volume price divergence) may indicate deeper correction ahead</p> <p><strong>Forex Tip:</strong> In forex markets, focus on patterns where trading volume expands during the later stages of the uptrend, confirming institutional participation</p> <h4>Volume During Stage 2: Formation of the Cup</h4> <p><strong>Ideal Pattern:</strong> U-shaped volume that decreases into the cup bottom and gradually increases during recovery</p> <p><strong>Entry Filter:</strong> The Cup bottom should coincide with the minimum volume levels</p> <p><strong>Warning Signs:</strong> Random trading volume spikes during cup formation often precede failed patterns</p> <p><strong>Statistical Tip:</strong> Bulkowski's research shows cups with U-shaped volume patterns outperform all other volume configurations</p> <h4>Volume During Stage 3: Formation of the Handle</h4> <p><strong>Optimal Behaviour:</strong> The handle volume should be below the cup's average volume</p> <p><strong>Warning Sign:</strong> Lower handle volume correlates with reduced volatility during breakouts</p> <p><strong>Failure Warning:</strong> Handle volume exceeding cup volume indicates potential premature accumulation</p> <p><strong>Position Sizing:</strong> May scale in when the handle shows textbook volume contraction</p> <h4>Volume During Stage 4: Price Breakout</h4> <p><strong>Entry Trigger:</strong> Light trading volume performs better during bullish Cup and Handle pattern breakouts, but requires an increase above the resistance; heavy volume is best in bear markets</p> <p><strong>False Breakout Tip:</strong> Apply a 2-bar confirmation rule (breakout bar plus following candle)</p> <p><img alt="Cup and Handle Volume (ThinkMarkets)" src="/getmedia/437e6adf-bc37-4645-9422-c1b2537a6340/Academy-Tech-analysis-Cup-and-Handle-T-Volume-Forms-a-U-Shaped-Pattern.png" /></p> <p style="text-align: center;">Cup and Handle Volume Forms a U-Shaped Pattern</p> <h3>3. Forex Trading Considerations</h3> <p>The structure of the forex market requires specific adaptations to the Cup and Handle strategy. We did cover in-depth how to use the Cup and Handle formation in the forex market in our first article, though the following considerations build more on the application side of things:</p> <h4>Session Considerations</h4> <p><strong>Optimal Breakouts:</strong> Prioritise patterns that complete during London or London-NY overlap sessions, as they carry more liquidity</p> <p><strong>Higher Failure Rate:</strong> Be cautious of Asian session Cup and Handle pattern breakouts</p> <p><strong>Volume Quality:</strong> Apply stricter volume criteria during major sessions; more flexible during thinner periods, if you can take more risk</p> <h4>Currency Pair Selection</h4> <p><strong>Best Performance:</strong> Major pairs (EUR/USD, GBP/USD, USD/JPY) show cleaner Cup and Handle formations</p> <p><strong>Secondary Choices:</strong> European crosses with sufficient liquidity (EUR/GBP, EUR/CHF)</p> <p><strong>Avoid:</strong> Exotic pairs where reliability decreases significantly</p> <h4>Economic Calendar Integration</h4> <p><strong>Pre-Event Warning:</strong> Avoid new entries 24 hours before high-impact events affecting relevant currencies</p> <p><strong>Position Adjustment:</strong> Consider reducing size when holding through major announcements</p> <p><strong>Stop Management:</strong> Consider widening stops when holding through medium/high-impact news events</p> <p>Once you have identified a high-quality pattern and considered the intricacies of the forex market, the next stage is systematic trade execution.</p> <h2>A Framework for Trading the Cup and Handle</h2> <p>The following trading framework outlines specific rules for entering, managing, and exiting Cup and Handle trades in the forex market.</p> <h3>Entry</h3> <h4>Bullish Entry Techniques</h4> <p>Unlike basic "buy the breakout" approaches, skilled forex traders implement specific entry strategies based on pattern characteristics and market conditions, as well as their risk appetite.</p> <p><img alt="How to Trade Cup and Handles (ThinkMarkets)" src="/getmedia/6bcaf5e2-5d34-47f5-931e-0bafe744bc48/Academy-Tech-analysis-Cup-and-Handle-T-Trading-Entry-Methods.png" /></p> <p style="text-align: center;">Cup and Handle Trading Entry Methods</p> <h4>Confirmation Techniques</h4> <p>For the highest probability entries, look for additional validation beyond price breaking resistance:</p> <ul> <li><strong>Volume Confirmation:</strong> Always require a minimum increase in volume compared to the pattern average</li> <li><a href="/en/trading-academy/forex/using-candlestick-patterns-in-forex-day-trading/">Candlestick Patterns</a>: Look for <a href="/en/trading-academy/technical-analysis/using-double-candlestick-patterns-in-day-trading/">bullish engulfing</a>, <a href="/en/trading-academy/technical-analysis/single-candlestick-patterns-a-guide-for-day-trading/">bullish marubozu</a>, or <a href="/en/trading-academy/technical-analysis/guide-to-day-trading-triple-candlestick-patterns/">three white soldiers</a> at the breakout level</li> <li><strong>RSI Validation:</strong> RSI above 50 with upward momentum adds conviction</li> <li><strong>Consolidation Break:</strong> Enter only after at least 2-3 candles of handle consolidation</li> </ul> <h3>Stop-Loss</h3> <p>A thorough approach to risk management begins with strategically placed stops based on pattern structure:</p> <ul> <li><strong>Handle-Based Stop:</strong> 10-20 pips below the lowest point of the handle</li> <li><strong>Fibonacci Approach:</strong> Below 38.2% (~ 50%) Fibonacci retracement of the depth of the cup when it has a clear, well-defined bottom</li> <li><strong>Volatility-Adjusted:</strong> 1.5× of the 20-period ATR below handle low for major pairs, 2.5× ATR for crosses or during volatile market conditions</li> <li><strong>Support-Based Stop:</strong> Just below the nearest support level under the handle when trading on higher timeframes (4H+)</li> </ul> <h3>Position Size</h3> <p>The classic forex position sizing formula should be adjusted based on pattern quality:</p> <p>Lot Size = (account size x risk percentage) / (stop in pips x pip value) / 1000:</p> <p>Example: $10,000 account, risking 1% on GBP/USD with 35 pip stop: ($10,000 × 1%) ÷ (35 × $1) ÷ 1000 = 0.29 lots</p> <p><strong>Pattern Quality Adjustments</strong></p> <ul> <li><strong>High-quality pattern:</strong> Standard risk (1-3% account)</li> <li><strong>Medium-quality pattern:</strong> Reduce risk to 1% max</li> <li><strong>Low-quality pattern:</strong> Reduce risk by 50%</li> </ul> <p><strong>Volatility Considerations</strong></p> <ul> <li><strong>ATR-Based Protection:</strong> During high-volatility periods, use Average True Range to adjust stop distance</li> <li><strong>News Protection:</strong> Add 20-25% to stop distance when holding through major economic releases</li> <li><strong>Correlation Risk:</strong> When trading multiple Cup and Handle chart patterns in correlated pairs, reduce overall exposure</li> </ul> <h3>Cup and Handle Pattern Target and Exit</h3> <p>Bulkowski's research shows clear statistical tendencies in how far Cup and Handle chart patterns typically move after breakout:</p> <h4>Multiple Cup and Handle Pattern Targets</h4> <p>Structure a tiered exit strategy based on statistical probabilities:</p> <ul> <li><strong>First Profit Target:</strong> 61.8% of cup height measured from breakout (50% reached by ~76% of patterns)</li> <li><strong>Second Profit Target:</strong> 100% of cup height (reached by ~50% of patterns)</li> <li><strong>Third Profit Target:</strong> 138.2% of cup height</li> </ul> <p>Remember that you can also use the handle in a similar manner, with extended projections potentially providing signals of Fibonacci clusters.</p> <h4>Position Scaling</h4> <p>Rather than all-or-nothing exits, implement partial position management:</p> <ul> <li>Exit 1/3 position at first profit target</li> <li>Move stop to breakeven after the first profit target hit</li> <li>Exit 1/3 at the second profit target</li> <li>Trail remaining 1/3 with chandelier exit (3× ATR from highest high)</li> </ul> <h4>Pattern-Specific Adjustments</h4> <p>Optimise Cup and Handle pattern targets based on specific pattern characteristics:</p> <ul> <li><strong>Tall patterns:</strong> May add 5% to profit target distances (statistical outperformance)</li> <li><strong>Short handles:</strong> May add 5% to profit target distances</li> <li><strong>Higher left cup lip:</strong> May add to profit target distances</li> <li><strong>Deep cup pattern in trading (or handle):</strong> Reduce profit target expectations</li> </ul> <p>By implementing this systematic framework for trade management, traders can transform the Cup and Handle from a mere chart pattern into a complete trading strategy with precise execution guidelines at every stage.</p> <h2>Bullish Cup and Handle Trading Strategy Example</h2> <p>Below is an example of a Cup and Handle trade on the daily chart of the USD/CAD currency pair, incorporating previously discussed aspects.</p> <h3>Bullish C&H Pattern Quality Assessment</h3> <p>First, let's classify this USD/CAD setup using our pattern quality framework:</p> <ol> <li><strong>Prior Uptrend:</strong> Clear uptrend from 1.20 leading to the pattern</li> <li><strong>Cup Formation:</strong> Well-defined U-shaped cup of 8 weeks, pulling back 40%</li> <li><strong>Cup Lip Symmetry:</strong> The left and right lips are equal; the left side is a tad higher</li> <li><strong>Handle Formation:</strong> Properly formed at the top of the cup; corrected 50% of the cup in 4 sessions (Important context: prices reversed on a bullish Marubozu engulfing nearly all the handle depth, otherwise this trade would be invalid)</li> <li><strong>Handle Duration:</strong> 4 days; considerably shorter than the cup, which is preferred statistically</li> <li><strong>Volume Behaviour:</strong> Declined during cup and handle formation, increased at handle support and following the bullish breakout</li> </ol> <p><img alt="Bullish Cup and Handle Trade, USDCAD Forex Pair (ThinkMarkets)" src="/getmedia/7c59166c-2691-4ad7-a26a-f57fc9115393/Academy-Tech-analysis-Cup-and-Handle-T-Trade-6-Step-Assessment-USDCAD.jpg" /></p> <p style="text-align: center;">Cup and Handle Trade 6-Step Assessment, USDCAD</p> <p>This USD/CAD example qualifies as a high-quality pattern because it displays all the key characteristics that Bulkowski's research identified as predictive of success:</p> <ul> <li>U-shaped cup</li> <li>Proper handle position considering the market context</li> <li>Very short handle duration in comparison to the cup</li> <li>Appropriate volume behaviour, with increases supporting higher prices alongside momentum</li> </ul> <h3>USDCAD Cup and Handle Trading Strategy</h3> <h4>1. Bullish Cup and Handle Pattern Entry</h4> <p><strong>Approach:</strong> Rather than using a generic entry, we applied the conservative entry approach - entering a 70% position when the price broke above the 1.3224 resistance level (at the close of the candle at 1.3250)</p> <p><strong>Volume Confirmation:</strong> The breakout showed light volume compared to the handle average</p> <p><strong>Session Consideration:</strong> The breakout occurred during the New York session, at optimal liquidity conditions</p> <p><strong>Technical Confirmation:</strong> RSI showed bullish divergence at the handle and got a boost past 50</p> <h4>2. Stop-Loss Placement</h4> <p><strong>Statistical Approach:</strong> We placed the stop at 1.2915 using the 61.8% Fibonacci retracement of the cup depth rather than simply below the handle low</p> <p><strong>Volatility Assessment:</strong> The 335-pip stop represented approximately 3× the average daily range of USD/CAD during this period (20-day ATR), appropriate for a major pair</p> <p><strong>Risk Alignment:</strong> This stop placement allowed for proper position sizing while accounting for the typical volatility characteristics of USD/CAD</p> <h4>3. Bullish Cup and Handle Pattern Target</h4> <p>Multiple Cup and Handle Pattern Targets</p> <ul> <li><strong>First Profit Target:</strong> 61.8% of cup height at 1.3532 reached 5 sessions after the Cup and Handle pattern breakout (along with RSI peak)</li> <li><strong>Second Profit Target:</strong> 100% of cup height at 1.3585 reached approximately 7 sessions after the Cup and Handle pattern breakout (RSI continued in overbought region)</li> <li><strong>Third Profit Target</strong> 138.2% of cup height reached approximately 20 sessions after the Cup and Handle breakout (price peaked while RSI fell, forming divergence)</li> </ul> <h4>4. Cup & Handle Exit</h4> <p>Following our framework, we:</p> <ul> <li>Exited 1/3 position at first profit target</li> <li>Moved the stop to breakeven after the first profit target was hit</li> <li>Exited another 1/3 at the second profit target</li> <li>Trailed remainder with a chandelier exit (3× ATR from highest high)</li> </ul> <p><img alt="Achieved Cup and Handle Target, USDCAD Forex Pair (ThinkMarkets)" src="/getmedia/da56535f-e0ba-47f8-8671-a191e2ea36b5/Academy-Tech-analysis-Cup-and-Handle-T-Bullish-Cup-and-Handle-Trade-USDCAD.jpg" /></p> <p style="text-align: center;">Bullish Cup and Handle Trade, USDCAD</p> <h3>Bullish Cup-Handle Trade Outcome and Adjustments</h3> <p>The Cup and Handle pattern breakout for the USD/CAD setup met and exceeded the height of the cup, validating the cup height projection method and achieving an approximately 2:1 (1.98) risk-to-reward ratio.</p> <p>We made the following pattern-specific adjustments based on our framework:</p> <ul> <li><strong>Higher Left Cup Lip:</strong> Employed a 3-prong take-profit strategy based on Bulkowski's finding that some patterns witness extended gains</li> <li><strong>Shorter Handle Duration:</strong> Added to Cup and Handle pattern target distances, as short handles historically outperform</li> <li><strong>Significant Pair Volatility:</strong> Used standard volatility parameters for stop trailing, as USD/CAD is a major pair</li> </ul> <h3>Key Lessons from the USDCAD Price Chart</h3> <p>This USD/CAD example illustrates how applying our structured approach to Cup and Handle trading in forex markets produces more consistent results:</p> <p><strong>Pattern Classification Matters:</strong> By properly classifying the pattern quality, we correctly allocated appropriate position size and risk parameters</p> <p><strong>Statistical Edge:</strong> Our stop placement at the 61.8% Fibonacci retracement level applied Bulkowski's maximum handle depth of 50%, leaving little room to manoeuvre</p> <p><strong>Forex-Specific Timing:</strong> By focusing on proper session alignment (NY session breakout), we ensured adequate liquidity for trade execution</p> <p><strong>Multi-Timeframe Validation:</strong> Verification of the pattern across timeframes (daily for pattern identification, H4 for handle analysis, and M15 for precise entry</p> <p><strong>Volume Analysis Framework:</strong> The U-shaped volume shape with an increase during the handle, followed by expansion after the breakout (lighter volume at breakout!), supplied extra confirmation</p> <p>The USDCAD example suggests how transforming basic Cup and Handle identification into a strategic trading methodology can improve trading results in forex markets.</p> <h2>Ready to Trade a Cup and Handle Formation?</h2> <p>When traded systematically, the Cup and Handle pattern represents one of the most reliable bullish continuation patterns. By implementing the framework outlined in this guide and our first article, forex traders can transform pattern recognition into a Cup and Handle trading strategy with solid rules for entering and exiting trades while managing pattern-specific risks.</p> <p>Success with trading Cup and Handle patterns depends not just on spotting them, but on understanding their fundamentals, qualifying their characteristics, and adapting trades to forex market conditions. When done correctly, Cup and Handle trading offers forex traders a statistically backed edge for capturing continuation moves in trending markets.</p> <div class="article__content"> <style type="text/css">.didyouknow { display: block; background: #F1FDf0; width: 600px; border-radius: 20px; gap: 20px; padding-top: 48px; padding-right: 40px; padding-bottom: 48px; padding-left: 40px; font-family: Figtree; font-weight: 600; font-size: 22px; line-height: 140%; letter-spacing: 0%; } </style> </div> <div style="text-align: center;"> <style type="text/css">.btn { font: Figtree; justify-content: center; align-items: center; text-align: center; gap: 7px; font-style: normal; font-size: 18px; line-height: 24px; padding: 13px 20px; border: 1px solid #ddd; border-radius: 38px; background: #5EE15A; } </style> </div> <div class="didyouknow">Are you Ready to Test Your Cup and Handle Trading Strategy?<br /> <br /> <a class="btn" href="https://portal.thinkmarkets.com/account/individual/" style="text-decoration: none; font-weight: 500; color: #000000; background: 5EE15A;" target="_blank">Try here!</a></div>
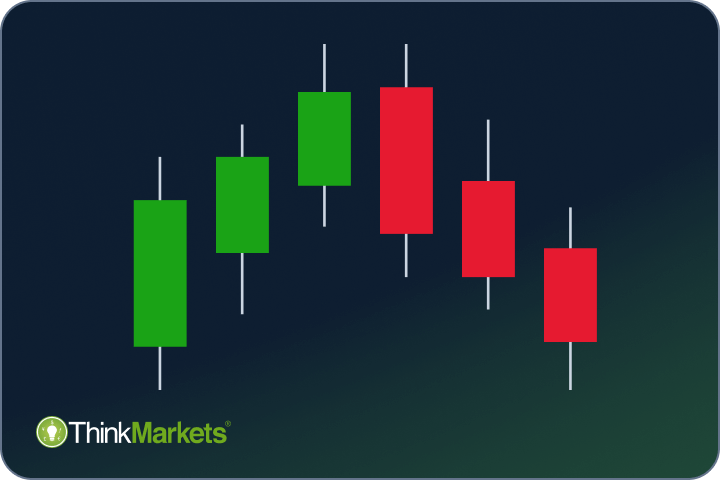
Using Candlestick Patterns in Forex Day Trading
<p>Candlestick patterns are one of the most used technical analysis tools in forex trading, helping day traders make quick decisions by instantly conveying market sentiment.</p> <p>Unlike other price action methods, candlestick patterns provide an on-the-spot snapshot of market psychology and intraday trends that often feel overwhelming.</p> <p>Candlestick patterns offer a time-tested, visual method to simplify this process, reveal buyer-seller psychology and help anticipate reversals, continuations and consolidations contextually.</p> <p>Learning about the different types of candlesticks and their meaning gives forex traders an edge in quickly interpreting good <a href="/en/trading-academy/forex/day-trade/">day trading</a> opportunities from bad.</p> <p>In this guide, you will learn:</p> <ul> <li>Reasons candlestick patterns are used for day trading forex</li> <li>The benefits that candlestick patterns provide to day traders</li> <li>Different types of candlesticks and patterns, and what they can signal</li> <li>What are the most common forex candlestick patterns traders must know</li> <li>How to systematically use candlestick patterns for day trading</li> <li>Common mistakes traders make when trading candlestick patterns</li> </ul> <h2>What are Candlestick Patterns in Forex Trading</h2> <p>Candlestick patterns are graphical representations of price action in a single or multiple bars across all timeframes.</p> <p>Each candlestick captures the open, high, low, and close prices, allowing forex traders to grasp market sentiment during a specific time period and prepare for potential changes.</p> <p>Generally speaking, when the close is above the open, the candlestick is bullish (green candlestick), while when the opposite occurs, it is a bearish candlestick (red candlestick).</p> <p>Note, the distance from open to close is called the “real body” of a candlestick. The price movements outside the body (upper or lower) are known as “wicks” or “shadows.” Here is the candlestick anatomy of a single candle:</p> <p><img alt="Anatomy of a Candlestick - (ThinkMarkets)" src="/getmedia/3359ba8e-0c47-4942-9752-4085396f5d1e/Academy-Candlestick-patterns-The-Anatomy-of-a-Single-Candlestick-Bar.png" /></p> <p style="text-align: center;">The Anatomy of a Single Candlestick Bar</p> <p>Candlestick patterns have the ability to convey market sentiment almost instantaneously. They are invaluable in helping traders make quick decisions under time-sensitive conditions in <a href="/en/trading-academy/forex/what-is-forex-trading/">forex trading</a>.</p> <p>Day traders in particular use them to assess market context across forex sessions, identify opportunities and anticipate trend continuations or trend reversals.</p> <p>When combined with <a href="/en/trading-academy/indicators-and-patterns/technical-indicators-beginners-guide/">technical indicators</a> and <a href="/en/trading-academy/technical-analysis/fundamental-analysis/">fundamental analysis</a>, candlestick analysis enables day traders to examine market behaviour quickly, interpret price action, and adapt to changing market conditions.</p> <p>Originating back to the 18th century in Japan by rice trader Munehisa Homma, the power of Japanese candlestick patterns has led to their widespread popularity.</p> <p>Today, <a href="https://www.amazon.com/Encyclopedia-Candlestick-Charts-Thomas-Bulkowski/dp/0470182016" target="_blank">over 100 candlestick patterns are in use</a>, according to the Encyclopaedia of Candlestick Charts (Thomas N. Bulkowski, 2008), with over 400 combinations in bullish and bearish markets.</p> <p>By recognising candlestick patterns that have stood the test of time, forex traders can gain a structured approach to decision-making and improve their overall performance.</p> <h2>Benefits of Forex Candlestick Patterns for Day Trading</h2> <p>Day traders find forex candlestick patterns beneficial because they provide high-resolution revelations about market price action in real time.</p> <p>The real value of candlestick patterns lies in the simplification of visual cues for market sentiment, especially on shorter timeframes such as the 1-hour chart used relentlessly in day trading.</p> <p>As the market’s overall psychology can change instantly during a trader’s trading session, when to take action on these candlestick signals is crucial, making timing and context key to candlestick analysis.</p> <p>Below are some of the key reasons why these forex candlestick patterns are invaluable for day trading:</p> <ul> <li><strong>View on Real-Time Market Sentiment:</strong> Candlestick patterns show the balance between buyers and sellers in real-time, which is helpful on shorter timeframes that day traders use to adapt to changing price action.</li> <li><strong>Improved Decision-Making Ability:</strong> Many candlestick patterns reduce guesswork because they provide supply/demand dynamics or simply integrate with <a href="/en/trading-academy/technical-analysis/support-resistance/">support/resistance levels</a> and trendlines, which helps confirm intraday signals.</li> <li><strong>Structure to Risk Management:</strong> The structure of a candlestick from open and close to low and high is used as key levels for entries and exits, helping day traders define risk parameters objectively.</li> <li><strong>Assessment of Trend Bias:</strong> There are <a href="/en/trading-academy/indicators-and-patterns/reversal-candlestick-patterns/">reversal candlestick patterns</a> and continuation candlestick patterns, which can act as warning signals about whether a trend is strengthening or losing momentum.</li> <li><strong>Adaptable Across Strategies:</strong> Candlestick patterns work across all major forex pairs, instruments, and <a href="/en/trading-academy/forex/popular-forex-trading-strategies/">trading strategies</a>, using one-bar candlesticks for scalping and triple or double candlestick patterns for swing trading.</li> <li><strong>Integration with Technical Tools:</strong> Candlestick patterns work easily and effectively with other indicators, improving a day trader’s ability to validate continuation or reversal patterns and improve strategy performance.</li> <li><strong>Proven Popularity and Reliability:</strong> A 2021 TradingView survey found that <a href="https://www.tradingview.com/chart/EURUSD/2Resussh-Fun-Facts-About-The-Last-12-Months-on-TradingView/" target="_blank">candlestick charts</a> remain the most popular choice among 131 million traders, making them more reliable due to higher trading volumes and thus more relevant in day trading.</li> </ul> <p>Candlestick patterns remain a cornerstone of day trading strategies in the fast-paced forex market.</p> <p><img alt="Benefits of Trading with Candlestick Patterns (ThinkMarkets)" src="/getmedia/c0d82ebf-ba5c-4a16-9c99-28383c03da1e/Academy-Candlestick-patterns-Benefits-of-Candlestick-Patterns-during-Day-Trading.png" /></p> <p style="text-align: center;">Benefits of Candlestick Patterns during Day Trading</p> <h2>Types of Candlestick Patterns and What They Signal</h2> <p>Whether forming by a single, double, triple or multiple bars, each candlestick pattern reveals unique insights into price action and market sentiment, with some performing better as bearish candlestick patterns and some others as bullish candlestick patterns.</p> <p>Below is a breakdown for active traders of the most common types of candlesticks and the signals they can generate when combined together:</p> <h3>Single Candlestick Patterns</h3> <p>Single candlestick patterns provide immediate signals of market sentiment and supply/demand dynamics. They are more effective during liquid forex sessions and forex pairs like EUR/USD and USD/JPY.</p> <p>Some of the most popular single candlestick patterns, like the Doji and Hammers, are used as reversal candlestick patterns or to signal indecision.</p> <ul> <li><strong>Doji, Long-Legged Doji patterns:</strong> <a href="/en/trading-academy/indicators-and-patterns/doji-candlestick-pattern/">The Doji candle pattern</a> has a small body with long wicks, indicating market indecision after notable pressure towards the candle open. The Long-Legged Doji candlestick, with longer wicks, also suggests increased indecision, but both, when used contextually, can indicate potential reversal.</li> <li><strong>Hammer, Inverted Hammer candlesticks:</strong> The Hammer has a small body with a long lower wick, while the <a href="/en/trading-academy/indicators-and-patterns/hammer-candlestick-pattern/">Inverted Hammer candlestick</a> has a long upper wick. Both are used as a bullish candlestick pattern after a downtrend, which means they are often considered a reversal candlestick pattern. When the Hammer candle appears at the top of an uptrend, it is known as the Hanging man candlestick pattern, whereas when the Reverse Hammer appears at the same position (up), it is known as the Shooting Star pattern. When in an uptrend, they are considered bearish reversal patterns.</li> </ul> <p><img alt="Popular Single Candlestick Patterns - (ThinkMarkets)" src="/getmedia/ca7153b0-fac1-4dd4-b8ca-6b9e41a0bd39/Academy-Candlestick-patterns-Popular-Single-Candlestick-Patterns.png" /></p> <p style="text-align: center;">Popular Single Candlestick Patterns</p> <h3>Double Candlestick Patterns</h3> <p>Double candlestick patterns offer stronger confirmation of sentiment changes than single candlestick patterns, combining price action over two candles. They are handy as high-probability trend reversals candlestick patterns when combined with volume.</p> <p>Some of the most prominent double candlestick patterns are the Engulfing and Harami patterns, which are used as trend reversal candlestick patterns as well as <a href="/en/trading-academy/indicators-and-patterns/continuation-candlestick-patterns/">continuation candlestick patterns</a>.</p> <ul> <li><strong>Bullish, Bearish Engulfing patterns:</strong> In an <a href="/en/trading-academy/indicators-and-patterns/bullish-bearish-engulfing-patterns/">Engulfing candlestick pattern</a> setup, the second candle engulfs the body of the first candlestick. It is considered a bullish candlestick pattern after a downtrend and a bearish candlestick pattern after an uptrend. Both bullish and bearish patterns are reversal candlestick patterns.</li> <li><strong>Bullish, Bearish Harami patterns:</strong> In a Harami setup, a small-bodied candle forms within the first candle's body (also known as insider bar formation). A bullish Harami suggests hesitation after a downtrend, while a bearish Harami indicates potential weakness after an uptrend. However, they are mostly regarded as reversal candlestick patterns.</li> </ul> <p><img alt="Popular Double Candlestick Patterns - (ThinkMarkets)" src="/getmedia/173d2e0b-f122-4dc9-a032-7813c7e5642f/Academy-Candlestick-patterns-Popular-Double-Candlestick-Patterns.png" /></p> <p style="text-align: center;">Popular Double Candlestick Patterns</p> <h3>Triple Candlestick Patterns</h3> <p>Triple canclestiock patterns offer an even improved confirmation of market sentiment. They often appear at critical support or resistance levels and are particularly useful as reversal candlestick patterns. These key patterns allow forex traders to act with greater confidence, especially near the end of highly active sessions.</p> <p>The Morning and Evening Star candlestick patterns are the most widely known formations day traders use, along with the three White Soldiers and Black Crows for those jumping into trending opportunities.</p> <ul> <li><strong>Morning Star, Evening Star patterns:</strong> In a Star formation, a long bearish or bullish candle is followed by a small-bodied candle (typically Doji), and then a long bullish or bearish candle confirms the reversal, forming a triple candlestick pattern. <a href="/en/trading-academy/indicators-and-patterns/morning-evening-star-candlestick-patterns/">A Morning Star pattern is a bullish candlestick pattern</a> after a downtrend, while an Evening Star pattern is a bearish candlestick pattern after an uptrend.</li> <li><strong>Three White Soldiers, Three Black Crows patterns:</strong> These are easily spotted but important candlestick patterns. They feature three consecutive long bullish or bearish candles with higher or lower closes, making up a triple candlestick pattern. <a href="/en/trading-academy/indicators-and-patterns/three-soldiers-black-crows-pattern/">The Three White Soldiers is a bullish pattern</a> in an uptrend, while the Three Black Crows is a bearish pattern in a downtrend. They are considered continuation candlestick patterns.</li> </ul> <p><img alt="Popular Three Candlestick Patterns - (ThinkMarkets)" src="/getmedia/fa9f810e-1a8f-4a43-b864-36f9a4a4c4ab/Academy-Candlestick-patterns-Popular-Triple-Candlestick-Patterns.png" /></p> <p style="text-align: center;">Popular Triple Candlestick Patterns</p> <h3>Multiple Candlestick Patterns</h3> <p>Multiple candlestick formations (spanning four or more bars) show more complex market dynamics over an extended period of time. While these patterns require more time to form, they provide more profound insights into future price movements.</p> <p>Some of the most common candlestick patterns that exceed seven bars are triangles, flags, pennants, and the legendary head and shoulders pattern, which are all common chart patterns.</p> <ul> <li><strong>Bullish, Bearish Triangle patterns:</strong> A symmetrical formation with converging trendlines near current trend completions or the ascending and descending variations with a flat line on the bottom or top. An <a href="/en/trading-academy/indicators-and-patterns/ascending-triangle-pattern/">ascending triangle</a> is considered a continuation candlestick pattern in an uptrend, while a <a href="/en/trading-academy/indicators-and-patterns/descending-triangle-pattern/">descending triangle</a> is regarded as a continuation pattern in a downtrend - i.e. breakout candlestick patterns.</li> <li><strong>Bullish, Bearish Flag patterns:</strong> <a href="/en/trading-academy/indicators-and-patterns/bear-bull-flag-pattern/">A bullish flag or a bearish flag pattern</a> is a sloping consolidation phase opposite of an ongoing trend. Bullish flags are a bullish continuation candlestick pattern in an uptrend, while bearish flags are a bearish continuation candlestick pattern in a downtrend.</li> <li><strong>Bullish, Bearish Pennant patterns:</strong> A <a href="/en/trading-academy/indicators-and-patterns/bear-pennant-pattern/">bullish pennant pattern or a bearish pennant pattern</a> is a symmetrical 3-point triangle within a trend, utilised most in day trading due to its faster completion than a triangle. Bullish pennants are a bullish candlestick pattern in an uptrend, while bearish pennants are a bearish candlestick pattenr in a downtrend.</li> <li><strong>Head and Shoulders, Inverse Head and Shoulders:</strong> <a href="/en/trading-academy/indicators-and-patterns/head-and-shoulders-bottom/">The Head and Shoulders chart pattern</a> is a bearish candlestick pattern after an uptrend, while the Inverse Head and Shoulders pattern is a bullish candlestick pattern after a downward trend.</li> </ul> <p>All types of candlesticks serve a specific purpose for forex trading, and their effectiveness increases when they are used in conjunction with other technical tools in context. For instance, supports and resistance levels are more important for reversals, while the volume technical analysis indicator often confirms breakouts that emerge in trend continuations.</p> <h2>Systematic Framework for Trading Candlestick Patterns</h2> <p>Candlestick patterns provide actionable advantages when part of a systematic framework, allowing day traders to gain crucial foresight into market sentiment.</p> <p>Below is a step-by-step process to help forex traders leverage all types of candlesticks and their patterns in day trading:</p> <h3>Step 1 - Select the Right Timeframe and Forex Session</h3> <p>Understanding that selecting the proper timeframe can be the difference between trading success and failure.</p> <p>Shorter timeframes, such as 5-minute to 15-minute charts, can provide more trading opportunities but are generally more volatile. A forex candlestick pattern on a 1-hour chart will have more strength, especially if confirmed by a higher timeframe, like the 4-hour and daily charts, which can provide that essential confirmation.</p> <p>Usually, 5-minute to 15-minute charts work best to enter and exit trades identified in higher timeframes. Imagine identifying a bullish hammer on the 4-hour timeframe and going down to the 15-minute timeframe to execute it.</p> <p>Be on your guard during the forex session overlaps when trading candlestick patterns. Trading volume and volatility usually increase then, which makes patterns more effective due to liquidity but also more prone to larger moves. Give it half an hour or so to see how developing patterns play out after the open.</p> <h3>Step 2 - Identify the Candlestick Pattern</h3> <p>Each pattern, whether single, double, or three-candlestick pattern, represents a potential bullish or bearish reversal or continuation in the short or longer term, but each conveys different insights.</p> <p>Start learning how to spot all candlestick patterns on your candlestick charts without additional indicators first. Once you get used to recognising at least the most popular candlestick patterns, you should be able to identify potential trading opportunities in no time. Test trading them before risking money.</p> <h3>Step 3 - Decide based on Market Context</h3> <p>After spotting a potential pattern, it’s essential to have basic guidelines for deciding what to do. Consider what is happening around the pattern for a chance at increasing its reliability. Assess historical price movements and areas of support and resistance. For instance, a bullish hammer candlestick pattern forming at a major support level is far more significant than when it appears in the middle of a range.</p> <p>Try to assess the current sentiment and conditions within the specific forex session. High trading volume can improve the reliability of candlestick signals, while quieter sessions or periods of low liquidity often produce false signals.</p> <p>By combining candlestick patterns contextually, one can filter out unreliable setups and remove emotional biases from trading decisions.</p> <h3>Step 4 - Confirm the Idea and Plan Entry</h3> <p>After identifying the pattern and making a decision, work on finding the best confirmation before entering a trade. This might sound harder than it really is. So, imagine a bullish engulfing pattern forms. A long position can be considered once the next candle closes above the high of the previous candle and volumes have increased.</p> <p>In a similar manner, the entry should be defined with precision and at a level that does not increase the profit target insensibly. Using the candlestick structure as a guide for entries and stop-loss ensures that the trade idea is grounded in objective criteria.</p> <h3>Step 5 - Optimise the Exit</h3> <p>Exiting trades properly is just as important as entering them, and sometimes even more critical due to the ongoing risk of market reversals while remaining in a trade. Day traders who use predefined profit targets or stops to lock in gains while protecting against reversals are better off than those who don’t.</p> <p>When setting a stop, one should do it structurally rather than dynamically unless it is a trailing stop. A structured stop below or above the low or high of a candlestick ensures market closeness instead of falling into the emotional circle of setting a stop loss that provides maximum risk:reward for the predetermined profit target.</p> <p>Note that an exit occurs in two cases: one, a profitable trade, and two, a lost one. Setting an optimal profit target is as important as the stop loss. If one does not make sense, wait for the next opportunity.</p> <h3>Step 6 - Follow Proper Position Sizing Principles</h3> <p>Make sure you follow proper position sizing principles to keep risk in check. Predefine risk tolerance and know how much capital to put down for each trade based on a percentage that never exceeds what one can afford.</p> <p>A rule of thumb is to never risk more than 1-2% of a trading account on any one trade. This disciplined process protects a day trading account and builds a trader’s trading skills and confidence month in and month out.</p> <p>Pro tip: Treat the position size for each trade in a dynamic way. Consider risking the 2% maximum size in high-probability setups while scaling it down in low-probability setups.</p> <p>Remember that 72% of retail investor accounts lose money trading CFDs. This statistic is a reminder that proper analysis and risk management are essential for success.</p> <h3>Trading Candlestick Patterns during Live Europe Forex Session, EURUSD</h3> <p>In a simplified, structured way, the following table showcases the steps taken to identify, evaluate and prepare a trade on EURUSD on Thursday, 4 April 2025, during the European session.</p> <p><img alt="EURUSD Candlestick Trading - (ThinkMarkets)" src="/getmedia/3537fc22-ff86-4652-81ee-7ba048af6fe3/Academy-Candlestick-patterns-EURUSD-Candlestick-Trading-Analysis.png" /></p> <p style="text-align: center;">EURUSD Candlestick Trading Analysis</p> <p>Following the 5-minute step-by-step process, where two bearish candlestick patterns were identified (3DC and BH), an entry has been placed at 1.1023 pending over the next few hours. If the price exceeds the stop loss level, the idea may get invalidated at higher levels. However, since the entry is at lower levels, pending a trend continuation, there is no risk from prices moving higher.</p> <p><img alt="EURUSD Candlestick Pattern Trading - (ThinkMarket)" src="/getmedia/a17b0496-ee3c-447c-971e-3934c6cc23c9/Academy-Candlestick-patterns-EURUSD-Trade-earish-Harami-Three-Dark-Crows-Combo.png" /></p> <p style="text-align: center;">EURUSD Trade, Bearish Harami - Three Dark Crows Combo</p> <p>Outcome: The trade was cancelled as several bullish candlesticks pushed prices above the 15-minute red candlestick that initiated the 3DC bearish pattern, suggesting its invalidation. In such scenarios, a consolidation is more likely during the next few sessions unless high momentum types of candlesticks re-emerge.</p> <h2>Common Mistakes in Candlestick Patterns Analysis</h2> <p>Candlesticks and their formations are essential for day trading the forex market, but misinterpretations can cause confusion and lead to harmful trading missteps.</p> <ul> <li><strong>Price Prediction Fallacy:</strong> Patterns indicate probabilities, not certainties. Always seek confirmation before acting.</li> <li><strong>Ignoring Market Context:</strong> A pattern’s reliability depends on its formation at key levels (support/resistance) and alignment with the broader trend.</li> <li><strong>Focusing on Poor-Quality Patterns:</strong> Prioritise well-formed patterns in liquid markets. Avoid acting on unclear or low-quality signals.</li> <li><strong>Using Candlestick Patterns in Isolation:</strong> Combine candlestick patterns with other <a href="/en/trading-academy/technical-analysis/what-is-technical-analysis-in-trading/">technical analysis</a> tools (e.g., volume, Fibonacci) for a comprehensive view.</li> <li><strong>Skipping Backtesting and Practice:</strong> Test patterns across different forex market conditions in a demo account before live trading.</li> </ul> <div class="article__content"> <style type="text/css">.didyouknow { display: block; background: #F1FDf0; width: 600px; border-radius: 20px; gap: 20px; padding-top: 48px; padding-right: 40px; padding-bottom: 48px; padding-left: 40px; font-family: Figtree; font-weight: 600; font-size: 22px; line-height: 140%; letter-spacing: 0%; } </style> </div> <div style="text-align: center;"> <style type="text/css">.btn { font: Figtree; justify-content: center; align-items: center; text-align: center; gap: 7px; font-style: normal; font-size: 18px; line-height: 24px; padding: 13px 20px; border: 1px solid #ddd; border-radius: 38px; background: #5EE15A; } </style> </div> <div class="didyouknow">Try our Proven 6-Step Candlestick Pattern Trading Method on Demo This Week.<br /> <br /> <a class="btn" href="https://portal.thinkmarkets.com/account/individual/" style="text-decoration: none; font-weight: 500; color: #000000; background: 5EE15A;" target="_blank">Apply Now</a></div> <h2>Final Thoughts</h2> <p>Candlestick patterns are an invaluable tool for day trading, but their effectiveness in interpreting market sentiment and price action depends on how well they are understood and applied during a forex session.</p> <p>It is important to remember that these day trading patterns and their historical precedent are not predictive guarantees, and they can only provide proper insights when used contextually by disciplined forex traders.</p> <p>As one refines their skills, they can start by backtesting different types of candlestick patterns for beginners first, practising on a demo, and slowly integrating them into a broader trading framework.</p> <p>Expectantly, with time and experience, trading forex candlestick patterns can become a reliable foundation for one’s day trading success in the financial markets.</p> <div> </div> <div> </div>
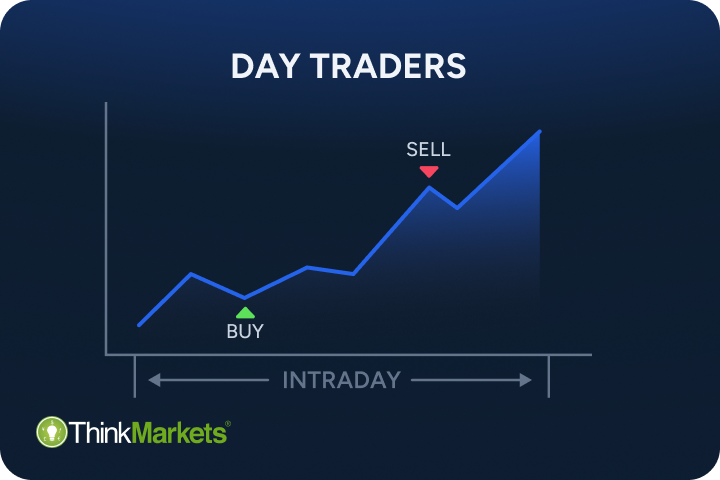
How to Day Trade: A Complete Forex Guide
<p>An increasing number of traders want to learn how to day trade. However, day trading demands preparation, discipline and a structured approach.</p> <p>While the forex market offers daily trading opportunities across different sessions, a lack of proper organisation and strategy can lead to losses and early burnout.</p> <p>This guide will take you through eight core elements of how to day trade, focusing on proven methods and a systematic approach to day trading forex.</p> <p>Whether you are a complete beginner or considering transitioning to forex day trading, you will learn how to develop a sound trading framework while understanding the associated risks and challenges.</p> <p><strong>What You Will Learn:</strong></p> <ul> <li>Day trading fundamentals and core trading strategies</li> <li>Must-have trading tools and skills needed to start day trading</li> <li>A structured eight-element approach to day trading forex</li> <li>The opportunities and challenges of intraday trading</li> <li>Success factors and practical tips to get you started</li> </ul> <h2>What is Day Trading in Forex Markets</h2> <p>Day trading, also known as intraday trading, involves opening and closing positions within the same day.</p> <p>Unlike traditional investors, forex day traders can capitalise on short-term price movements 250 trading days per year.</p> <p><a href="/en/trading-academy/forex/how-to-trade-forex/">Forex markets</a> operate 24/5. While requiring constant monitoring, this allows day traders to execute 3 to 15 trades across different sessions. That is far more than other markets. Nonetheless, beginner traders typically start with a few trades a week and avoid participating in active trading.</p> <p>Comparing forex day traders with stock day traders in the US, the latter face restrictions under official “pattern day trader” day trading rules and regulations. They must hold a minimum of $25,000 in their margin trading accounts to maintain buying power and place four or more day trades within a five-business-day period that exceeds 6% of their trading activity. If the account falls below this limit, the trader will be restricted from intraday trading until the balance is restored.</p> <p>On the other hand, forex day trading is a form of trading that requires minimal capital and offers greater flexibility, though it demands constant monitoring. It is not as much about how many trades per day one makes or day trading limits, but more about taking the right trade and achieving the day trader's goals.</p> <p><strong>Key Characteristics of Day Trading in Forex Markets</strong></p> <p><img alt="Characterisirtcs of Forex Day Trading (ThinkMarkets)" src="/getmedia/ea80f1c7-fb6a-4e39-8221-3aedd30218ff/Academy-Forex-Characterisirtcs-of-Forex-Day-Trading-ThinkMarkets.png" /></p> <p style="text-align: center;">Characterisirtcs of Forex Day Trading (ThinkMarkets)</p> <h2>How Does Day Trading Work in Forex</h2> <p><a href="/en/trading-academy/forex/what-is-forex-trading/">Forex trading</a> market hours are separated into three main sections: Asian (Sydney/Tokyo), European (London), and American (New York).</p> <p><img alt="Forex Sessions GMT - ThinkMarkets" src="/getmedia/48dcdf14-fac2-44b1-bfc2-8e9ee74f741b/Academy-Forex-Day-Trading-Session-Times-in-GMT.png" /></p> <p style="text-align: center;">Forex Session Times in GMT</p> <p><strong>Forex Trading Sessions (GMT)</strong></p> <ul> <li>Australian Session (21:00-06:00 GMT): Lower volatility, focus on AUD pairs</li> <li>Tokyo Session (23:00-08:00 GMT): Lower volatility, focus on JPY pairs</li> <li>London Session (07:00-16:00 GMT): Highest liquidity, major pairs</li> <li>American Session (12:00-21:00 GMT): Slower USD pairs trading</li> </ul> <p>When forex sessions overlap, they create periods of higher liquidity - an optimal time for day trading signals. The London-New York session overlap is typically the best time for day trading.</p> <p>However, liquidity can vary throughout a day’s session. This affects trade frequency among <a href="/en/trading-academy/technical-analysis/method-to-analyse/">trading styles</a> and types, which has resulted in a preference for different forex trading strategies.</p> <h2>Core Day Trading Strategies in Forex</h2> <p><a href="/en/trading-academy/forex/popular-forex-trading-strategies/">Forex day trading strategies</a> fit different trading approaches and time commitments. Consider choosing yours based on your personality, schedule and trading goals.</p> <p>There are many day trading forex strategies one can utilise. The four most popular are:</p> <ol> <li><strong>Scalping</strong> is the fastest type of day trading forex strategy. Scalpers aim to profit from small movements over very short periods. This requires precise execution and strong risk management. Successful scalpers have strong emotional control and technical analysis skills.</li> <li><strong>News trading</strong> involves capitalising on (expected) market volatility (before or) after major news releases. Successful news traders combine economic calendars and strong fundamental analysis skills with quick interpretations. While its potential is high, it comes with a higher risk. Many day traders lose money due to increased volatility associated with news trading.</li> <li><strong>Trend following</strong> is a more measured approach to catching price moves until the end of the day. It involves fewer trades and requires patience and the ability to tell genuine from false moves. Successful trend day traders are good at pattern recognition and entry and exit discipline.</li> <li><strong>Range trading</strong> allows traders to focus on structured periods of price action when prices oscillate within established support and resistance. Range traders must possess strong price action skills and the means to identify entry and exit points before breakouts.</li> </ol> <p>The best forex trading strategies are typically built by finding the right combination of risk tolerance and time.</p> <p><img alt="Most Popular Day Trading Forex Strategies (ThinkMarkets)" src="/getmedia/828e9d36-2646-47cf-a7fa-15a785681767/Academy-Forex-Most-Popular-Day-Trading-Forex-Strategies-ThinkMarkets.png" /></p> <p style="text-align: center;">Most Popular Day Trading Forex Strategies (ThinkMarkets)</p> <h3>Simple Day Trading Strategy Example</h3> <p>In the following example, a top inside bar candlestick formation is observed during the New York session on EURUSD, March 17. The momentum in the RSI peaked while volumes started to trend lower, signalling the end of day (EOD) trend and a potential consolidation between 1.0910 and 1.0930.</p> <p><img alt="EURUSD EOD Trade into Consolidation, Inside Bar Reversal" src="/getmedia/84d151ec-d45c-48b1-ba29-f1c055a1a69b/Academy-Forex-Day-Trading-EURUSD-EOD-Trade-into-Consolidation-Inside-Bar-Reversal.png" /></p> <p style="text-align: center;">EURUSD EOD Trade into Consolidation, Inside Bar Reversal</p> <p>Indeed, prices moved to the top of the range after finding support at the previous resistance (flipped support) and reverted back to the lower end of the consolidation. Following a slight drop below support, with low volumes, EURUSD shot back to the top and eventually broke higher on March 18 during the European session.</p> <p><img alt="EURUSD Range Bottom Bounce with False Break" src="/getmedia/59511d89-dc35-4a2b-bba6-2466a5ae0f87/Academy-Forex-Day-Trading-EURUSD-Range-Bottom-Bounce-with-False-Break.png" /></p> <p style="text-align: center;">EURUSD Range Bottom Bounce with False Break</p> <h2>How to Choose a Day Trading Strategy</h2> <p>Choosing a day trading strategy requires one to match various criteria to personal characteristics and preferred trading sessions. For instance, some traders do better in scalping, while others in sideways and trending markets – more structured approaches. Trading experience also plays a role in choices.</p> <p>Market factors influence strategy selection. Can you handle volatility? Do you have adequate capital for scalping costs? All of these questions play a vital role in how one selects the most successful day trading forex strategy for them.</p> <p>Some day trading forex strategies demand constant market monitoring, while others allow more flexible time management. But the best type of trading strategies are often built when one considers their daily schedule, session duration, and income goals.</p> <p><strong>Day Trading Strategy Selection Criteria</strong></p> <p><img alt="how to select a day forex strategy" src="/getmedia/df6980fe-3a05-4ef6-95f4-08c32b3a0942/Academy-Forex-Day-Trading-How-to-select-a-day-forex-strategy.png" /></p> <p style="text-align: center;">How to select a day forex strategy</p> <p>A scoring system can be formed using the most important selection criteria. Once decided, one can develop a structured approach for the selected day trading forex strategy and create a trading plan.</p> <p>But successful day traders typically spend several months learning and paper trading. If you jump into day trading as a beginner, you must develop multiple skills before getting skin in the game.</p> <h2>Must-Have Skills to Begin Day Trading Forex</h2> <p>Success in day trading forex depends on continuous learning; skill development is essential for long-term sustainability.</p> <h3>Technical Analysis</h3> <p>The main tool day traders use in forex is technical analysis, <a href="https://www.quantifiedstrategies.com/day-trading-statistics/" target="_blank">with 89% using it</a>. Day trading chart patterns, such as flags, head and shoulders, and triangles, coupled with candlestick patterns, help traders decide when to enter trades and when to exit.</p> <p>Understanding day trading <a href="/en/trading-academy/indicators-and-patterns/technical-indicators-beginners-guide/">technical indicators</a> like moving averages, RSI, and MACD can help traders identify trends and potential reversal points. The best indicators for day trading are usually the simplest ones.</p> <p>Trend and momentum trading skills allow many day traders to position themselves with the market direction. But not even the best technical indicator for day trading works well in complete isolation.</p> <p>When combining trends with volume and volatility indicators, day traders can confirm price breakouts and validate periods of institutional activity. A lack of volume typically translates to fakeouts, as indicated in the EURUSD example.</p> <p><a href="/en/trading-academy/technical-analysis/what-is-technical-analysis-in-trading/">Technical analysis</a> in day trading forex requires understanding short- and long-term price action through multiple timeframe analyses. Start with the daily charts and move down to 1-hour or 15-minute charts.</p> <h3>Fundamental Analysis</h3> <p><a href="/en/trading-academy/technical-analysis/fundamental-analysis/">Fundamental analysis</a> includes scheduled economic data and the reaction of the actual numbers on currency pairs. Understanding the post-release reaction helps traders anticipate market volatility.</p> <p>Breaking news from unexpected developments is another form of analysis. It is not technical but could impact fundamentals. Figuring out the impact of breaking news requires quick thinking and decision-making skills. Social media can influence sentiment. However, <a href="https://afajof.org/management/viewp.php?n=64120" target="_blank">a Harvard study</a> found that trades based on social media generally underperform.</p> <p>Intermarket correlations provide valuable context for trading decisions. For example, how the Australian dollar or the German DAX react to Chinese trade data provides day trading signals or helps change trading decisions.</p> <p>Geopolitical awareness is also important in day trading forex these days. Successful day traders have a broad knowledge of international relations and their potential impact.</p> <p><img alt="Trading with the Economic Calendar (ThinkMarkets)" src="/getmedia/1752e600-f0aa-45da-bd11-a4fca01e935d/Academy-Forex-Day-Trading-ThinkMarkets-Economic-Calendar.png" /></p> <p style="text-align: center;">ThinkMarkets Economic Calendar</p> <h3>Risk Management</h3> <p>Risk management is mandatory in day trading, especially when using leverage in forex. Day traders using margin accounts lose more than those who do not. In contrast, successful traders aim for capital preservation and employ strict position sizing and risk limit rules.</p> <h3>Psychological and Emotional Traits</h3> <p>The best day traders develop strong emotional traits without letting winning or losing streaks affect their decision-making. Those who manage to stay disciplined and handle stress are more likely to be profitable over 6 months.</p> <h2>Essential Tools and Resources For Day Trading</h2> <p>A professional setup requires specific day trading tools and resources to support decision-making and trading discipline.</p> <p>Here is what beginner day traders need:</p> <ul> <li><strong>A good trading platform</strong> serves as the command centre for day trading forex. MT4 is a popular platform but probably not the best day trade platform, given that it lacks advanced features.</li> <li><strong>Real-time news sources</strong> to stay up-to-date with the latest news and events affecting FX pairs.</li> <li><strong>An integrated economic calendar</strong> that helps traders plan sessions around high-impact news.</li> <li><strong>Trading strategy backtesters</strong> allow day traders to test a strategy, optimise it, or simply abandon it for testing the next one.</li> <li><strong>Educational resources</strong> to continually develop skills, including experienced-based courses and webinars.</li> </ul> <p>This approach to tools and resources creates a professional trading environment that improves one’s ability to decision-making and helps maintain trading discipline.</p> <h2>How to Day Trade Forex Appropriately</h2> <p>A structured approach to day trading removes ambiguity from trading decisions. Here are the main eight core elements that must be addressed for day trading forex:</p> <ol> <li><strong>Market Selection</strong><br /> <br /> Choose highly liquid forex pairs like EUR/USD for consistent execution and tight spreads. Major pairs offer predictable price movements and lower transaction costs compared to other pairs. Start with one or two pairs until you develop proficiency.</li> <li><strong>Trading Time</strong><br /> <br /> Select specific forex trading market hours that align with major sessions. The London-New York overlap offers optimal liquidity and day trading signals. Commit to trading the same hours daily to understand volume patterns and price action. A focused 1-2 hours session is more effective.</li> <li><strong>Pre-Market Analysis</strong><br /> <br /> Review your trading charts before your session begins and draw strong support and resistance levels on the daily or 4-hour timeframes for a broader view. Make notes of the highest-probability day trading signals, but check the calendar to know what’s moving and when before committing to trade.</li> <li><strong>Trading Setup</strong><br /> <br /> Set up your trading platform with technical indicators and open a new window for the real-time news feed. Set up alerts for potential entry points and economic calendar notifications. Organise your workspace with multiple timeframes and add the one-click trade pop-up on your selected pairs.</li> <li><strong>Entry And Exit</strong><br /> <br /> Use the simple moving average for trend direction and the RSI for validation. Enter only when multiple signals line up. Set profit targets and stop-losses based on daily levels and ranges. Close all positions by the end of the session and do not hold overnight.</li> <li><strong>Risk Management</strong><br /> <br /> Limit risk to 1-2% per trade, set strict daily loss limits, and maintain adequate capital reserves. Avoid adjusting take-profit targets or stop loss levels once in a trade. Let the trade run, but ensure you are not overexposed or overleveraged at any time.</li> <li><strong>Journaling</strong><br /> <br /> Document every trade with entry and exit points, rationale, market conditions, and anything that helped identify the opportunity. Include screenshots of setups and note emotional states during trades. Review this regularly to refine your strategy.</li> <li><strong>Continuous Learning</strong><br /> <br /> Study winning trades to repeat their success. Stay updated with new tools, resources or courses offered at your selected broker, but also consider joining trading communities to gain insights. Adapting is crucial for future success.</li> </ol> <h2>Forex Day Trading Pros and Cons</h2> <p>Forex day trading presents both significant opportunities and challenges that many aspiring traders underestimate.</p> <p>Let's examine some pros and cons of day trading for beginners to help you make an informed decision before committing time and real money:</p> <h3>Pros of Day Trading</h3> <p><strong>Profit Potential:</strong> Day trading may offer multiple daily opportunities for quick capital turnover and fast realisation of gains, especially when used with proper leverage.</p> <p><strong>Market Flexibility:</strong> The 24/5 forex market operation allows trading from anywhere with multiple currency pairs and strategies and instant execution.</p> <p><strong>Risk Control:</strong> A large percentage of successful day traders managed their positions in real-time, which allows adjustments to limit intraday risks. However, trading is inherently risky.</p> <h3>Cons of Day Trading</h3> <p><strong>Time Commitment:</strong> Day trading requires focused market participation during trading hours, good preparation, continuous learning, and real-time decision-making.</p> <p><strong>Psychological Demands:</strong> The high-stress environment of the active forex market requires emotional control to avoid decision fatigue and the pressure associated with daily performance.</p> <p><strong>Capital Requirements:</strong> It requires enough trading capital for the highest probability positions, plus costs for good trading tools or resources.</p> <h4>Day Trading Pros and Cons (Extended)</h4> <p><img alt="Day Trading Pros and Cons (ThinkMarkets)" src="/getmedia/c82ef0d2-61d0-4fd8-a729-08fe5fc2bd82/Academy-Forex-Day-Trading-Day-Trading-Pros-and-Cons-ThinkMarkets.png" /></p> <p style="text-align: center;">Day Trading Pros and Cons (ThinkMarkets)</p> <h2>Day Trading Tips</h2> <p>Successful day traders follow tested principles rather than just technical analysis or knowledge. From years of market experience and real results, the following day <a href="/en/trading-academy/technical-analysis/10-tips-to-successful-trading/">trading tips</a> might help you build a more disciplined and systematic trading routine.</p> <p><strong>Focus on High Liquidity:</strong> Trade major currency pairs with tight spreads for better execution, lower transaction costs, and smoother entries and exits.</p> <p><strong>Time Your Trades:</strong> Avoid the most volatile periods initially and consider waiting 15-20 minutes after markets open to let price action settle and avoid false breakouts.</p> <p><strong>Risk-Reward:</strong> Target at least 1:2 risk-reward on every trade, so your potential gains are twice your possible losses.</p> <p><strong>High-Probability Setups:</strong> Only enter trades when multiple technical indicators line up with your strategy, even if that means you miss a trading day. Performance is more important than labels.</p> <p><strong>Multiple Strategies and Time Frames:</strong> Adapt your approach to the market and analyse different time frames to get the full picture.</p> <p><strong>Review:</strong> Regularly review your journal to find patterns in your wins and losses. It will help refine your strategy and decision-making.</p> <p><strong>Take a Break:</strong> Step away from trading after big wins or losses to stay emotionally balanced and avoid decisions that can damage your account.</p> <p><strong>Never Trade with Money You Can’t Afford to Lose:</strong> Most traders lose money in the long run. Only trade with money you can afford to lose for day trading. Protect your financial stability.</p> <h2>Conclusion</h2> <p>Day trading forex requires market knowledge, a structured approach and the right combo of technical and fundamental skills, risk management, and emotional discipline. Throughout this guide, we have outlined the eight core elements that shape the foundation of effective day trading, from market selection to continuous learning.</p> <p>Successful traders focus on consistency through proper risk management and detailed record-keeping rather than aggressive trading. Remember that forex markets, while offering abundant opportunities, carry significant risks.</p> <p>Whether starting now or transitioning from other strategy types, focus on building a strong foundation first. Progress comes from patience, discipline, and continuous improvement. Protect your capital, maintain detailed records, and trade within your means.</p>
Trading Forex with the Reverse Martingale Strategy: Insights, Execution, and Risks
<p>The Reverse Martingale strategy, also known as the anti Martingale strategy, is a popular approach used for risk management in Forex trading. It is a position sizing strategy that leverages winning streaks and does not attempt to recover consecutive losses like the classic Martingale system.</p> <p>Its focus on wins inspires trend traders to use it during a Forex trend or momentum trading. The Reverse Martingale strategy capitalises on directional movements, effectively "riding the wave" of an established trend in Forex.</p> <p>Compared to the classic Martingale, the anti Martingale system assumes a more conservative risk management profile. While the Martingale doubles the trade size after a loss, the Reverse Martingale trading strategy resets it or at least halves it.</p> <p>In this article, we will explore the mechanics of the Reverse Martingale method, how it is used with trend following strategies, and the potential pros and cons associated with its use.</p> <h2>What is the Anti Martingale Strategy in Forex Trading</h2> <p>The anti Martingale strategy in <a href="/en/trading-academy/forex/what-is-forex-trading/">Forex trading</a> doubles up the trade size after every win and resets it to the original position size after every loss. For instance, winning a 1 lot trade three times in a row produces 8 lots, while resetting to the original position size of 1 lot after every loss.</p> <p>The anti Martingale system is employed by traders who seek to capitalise on winning trades and attempt to minimise losses during unfavorable market conditions. The net loss is always equal to the initial stake.</p> <p>At its core, the anti Martingale system often confirms a Forex trend during a winning streak, which may create a more sustainable path to account growth. However, it is more suited for trend traders with validated trend following strategies.</p> <p>The long-term returns on 1000 lots traded below simulate how suitable the Reverse Martingale is when used in conjunction with trend trading strategies or during sideways markets. However, simulations in any type of auto trading software do not guarantee future results.</p> <p><img alt="Reverse Martingale Performance in Trending Markets" src="/getmedia/6c74d45f-bf89-4ae3-83df-370c2f388d4f/Academy-Forex-Reverse-Martignale-Anti-Martingale-Strategy.png" /></p> <p style="text-align: center;">Reverse Martingale Performance in Trending Markets<sup><a href="#image-footnote-1">(1)</a></sup></p> <p>The Reverse Martingale strategy may work well during intraday trading on Forex currency pairs like EUR/USD, GBP/USD, and USD/JPY. Forex trends can be identified with ease when measured with a moving average or other trend trading indicators, such as the Moving Average Convergence Divergence (MACD) or the <a href="/en/trading-academy/indicators-and-patterns/rsi-indicator/">Relative Strength Index (RSI)</a>.</p> <h2>How Does the Reverse Martingale Strategy Work in Trading</h2> <p>The Reverse Martingale in trading works by doubling up the position size after a win to capitalise on gains and resetting it after a loss in an attempt to minimise losses. However, trading is risky, and trading with the anti Martingale system may still lead to substantial losses.</p> <p>Here is how the anti-Martingale system works when trading the Forex markets:</p> <ol> <li><strong>Initial Investment:</strong> Begin with a fixed lot size or account percentage that is comfortable to risk, as it sets the base for the position size increases.</li> <li><strong>Set Profit and Loss Targets:</strong> Establish clear profit and loss targets and how many cycles to double down for before entering a trade.</li> <li><strong>Double Down on Wins:</strong> After a win, double down on the next trade to capitalise on the gains of the previous trade.</li> <li><strong>Reset after Loss:</strong> When a trade results in a loss, revert to the initial position size, as it ensures risking only the initial stake at any time.</li> </ol> <p>Consider the intraday trading journey of a Reverse Martingale trader as an example:</p> <p><img alt="Reverse Martignale vs. Clasic Martingale" src="/getmedia/67589714-f499-4626-ba4e-62b74337c6d8/Academy-Forex-Reverse-Martignale-vs-Clasic-Martingale.png" /></p> <p>Due to the leveraged nature of currency markets, some traders increase the amount of a trade size by 20% to 50% instead of doubling it each time. However, the value of trades that win is reduced in such cases. They sometimes employ a more strict <a href="/en/trading-academy/forex/risk-management/">risk management</a>, resetting to the original stake immediately after a single loss.</p> <h3>Example of Reverse Martingale Trade during EUR/USD Trend</h3> <p>Consider starting a long position of 0.1 lots in a EUR/USD uptrend in Forex. Here is how four 100-pip winning trades would look like:</p> <p><img alt="EURUSD Reverse Martingale Trade - ThinkMarkets" src="/getmedia/edc94578-f83a-4897-9f92-818b4550865a/Academy-Forex-Reverse-Martignale-EURUSD-RM-Trade.png" /></p> <p style="text-align: center;">Anti Martingale Trade in EURUSD Uptrend</p> <h2>What Makes the Anti-Martingale Strategy Better than Martingale</h2> <p>Some Forex traders assume that the Reverse Martingale system is a system of higher superiority to the standard Martingale because it prioritises capital preservation. It is fundamentally the reverse of the traditional Martingale system, which doubles the position size after each loss.</p> <p>A simulation compared head-to-head the performance of the anti-Martingale and Martingale strategies on a single trade. On the one hand, it showed the Reverse Martingale trade gaining during a trend following strategy and flatlining during a flat market. On the other hand, the Martingale trade performed well during the flat market until a trade loss and doubling up resulted in the depletion of the account. However, simulated performance is not an indication of future results.</p> <p><img alt="Anti-Martingale Trade Performance" src="/getmedia/c3db7748-5d08-49b5-80cc-8e023b6406db/Academy-Forex-Anti-Martingale-Trade-Performance.jpg" /></p> <p style="text-align: center;">Anti-Martingale Trade Performance<sup><a href="#image-footnote-1">(1)</a></sup></p> <p>The simulation results or the assumption of superiority does not change the equal probability of winning or losing individual trades. Nonetheless, the ability to limit losses and leverage winning streaks during a trend trading strategy could lead to less severe outcomes over time.</p> <p>Here are the main reasons some traders prefer using the anti-Martingale trading system instead of the Martingale strategy.</p> <h3>Capital Preservation</h3> <p>The Martingale and anti-Martingale strategies use similar mechanics. However, the anti Martingale strategy aims to reduce exposure after losses, while the Martingale increases it. By reducing position sizes after losses, traders protect their capital from large drawdowns.</p> <h3>Capitalises on Wins</h3> <p>The Martingale system is a betting system that attempts to recover losses, while the Reverse Martingale capitalises on a hot streak. This focus on wins may create a more sustainable path to account growth, though the outcome of the next trade can never be certain.</p> <h3>Riding Momentum</h3> <p>The anti Martingale strategy involves doubling the trade size after each win, often confirming market momentum. Conversely, the classic Martingale strategy relies on the principle of mean reversion, which suggests a sideways market.</p> <h3>Psychological Edge</h3> <p>The anti Martingale strategy trade size resets prevent revenge trading and chasing losses, while scaling during a series of winning trades can boost trader confidence. The Reverse Martingale is essentially a strategy that promotes a "let profits run" approach, a strategy less prone to revenge trading.</p> <p><img alt="Reverse Martignale vs. Clasic Martingale" src="/getmedia/61a8387d-780d-4844-b8b2-e2c26f49639e/Academy-Forex-Reverse-Martignale-vs-Clasic-Martingale-table.png" /></p> <h2>When Do Traders Switch to the Anti-Martingale Strategy</h2> <p>Traders typically consider switching to the anti-Martingale strategy after a series of losing streaks while using the traditional Martingale system. This logical transition prompts them to seek a more mature approach to risk management and capital preservation.</p> <p>Specifically, traders commonly switch to Anti-Martingale when:</p> <ul> <li><strong>They experience significant losses</strong> using the traditional Martingale and have experienced a losing streak.</li> <li><strong>They appreciate capital preservation</strong> and understand the importance of protecting their trading capital.</li> <li><strong>They seek psychological comfort</strong> through a strategy that rewards wins rather than keeps doubling sizes after losses.</li> <li><strong>They develop stronger market analysis skill</strong>s, becoming confident in the use of trend <a href="/en/trading-academy/indicators-and-patterns/technical-indicators-beginners-guide/">indicators</a> and momentum strategies.</li> </ul> <p>Professional traders selectively use the anti Martingale strategy rather than as a next bet, employing it when they spot strong market momentum. In simpler terms, they count on the consistency of their intraday trading strategies and the ability to remain disciplined in their risk management rules.</p> <h2>Risks of Using the Reverse Martingale in Forex Trading</h2> <p>While it can, at times, bear fruit, the Reverse Martingale strategy does not come without its risks, even though it uses different trading criteria. Being aware of such risk can help traders make better decisions and potentially manage their exposure more effectively.</p> <p>The potential risks traders face when using the Reverse Martingale strategy in Forex trading are:</p> <ul> <li><strong>Loss of Accumulated Profits:</strong> Profits reinvested into progressively larger positions can quickly dissipate following a single losing trade.</li> <li><strong>Exposure to Market Reversals:</strong> Larger positions after wins increase the odds of reversals in a trend in Forex – particularly in volatile financial markets.</li> <li><strong>Difficulty in Size Reduction:</strong> Some traders struggle to reduce lot sizes after experiencing losses, which typically leads to poor strategy execution.</li> <li><strong>Overconfidence and Poor Risk Assessment:</strong> A series of wins can lead traders to underestimate potential risks, fail to analyse trades properly, and eventually ignore trading plans.</li> <li><strong>Dependence on Exit Timing:</strong> Difficulty timing exits can compel some traders to hold large positions for longer that they should, risking profit erosion.</li> </ul> <h2>How to Trade with the Reverse Martingale Strategy in Forex</h2> <p>Trading Forex with the Reverse Martingale strategy requires sticking to risk management rules, disciplined scaling and resetting execution, and a strong emotional acumen.</p> <p>Below are some key guidelines for trading with the Reverse Martingale strategy in Forex:</p> <ul> <li><strong>Establish a Base Position Size:</strong> Define an initial trade size based on your risk profile and account size. This base size serves as your starting point and the position you reset to after losses.</li> <li><strong>Clearly Define Position Sizing Rules:</strong> Set clear rules for increasing positions after winning trades (often doubling) and reverting to base size after losses. Stick to these rules to maintain strategy integrity.</li> <li><strong>Identify Clear Market Trends and Momentum:</strong> The Reverse Martingale strategy is best utilised in Forex trend trading. Trend traders should confirm the direction using trend indicators such as moving averages and trendlines, or confirm market momentum.</li> <li><strong>Set Strict Risk Management Parameters:</strong> Always use predefined stop-loss and take-profit levels. Consider setting a maximum position size or a cap on consecutive lot-size increases to prevent excessive exposure.</li> <li><strong>Regularly Review and Adjust the Strategy:</strong> Continuously evaluate your trading performance and market conditions, and adjust your trading style as necessary.</li> </ul> <h3>Step-by-Step Reverse Martingale Trading at ThinkMarkets</h3> <p>Implementing the Reverse Martingale strategy takes many steps, but this process is straightforward with ThinkMarkets. ThinkTrader offers a range of advanced tools to help traders automate trades and increase efficiency in trade execution.</p> <p>Next is a step-by-step EURUSD trade on how to use the Reverse Martingale strategy at ThinkMarkets.</p> <h4>Step 1: Establish Your Base Position Size</h4> <p>Consider trading the pair on ThinkTrader. First, calculate your position size. With a $10,000 account, a conservative approach might be a 0.1 lot position (approximately $100 risk per trade). Enter this value in the ThinkTrader order window.</p> <p><img alt="EURUSD Anti Martingale Trade - ThinkMarkets" src="/getmedia/bdfa5163-0a8e-4510-9710-cf6cbf77e3a4/Academy-Forex-Reverse-Martingale-EURUSD-RM-Order.png" /></p> <p style="text-align: center;">EURUSD Anti Martingale Order</p> <h4>Step 2: Define Your Position Sizing Rules</h4> <p>Using the ThinkTrader notes feature or a journal, document your specific Reverse Martingale progression rules. For example:</p> <ul> <li>After a winning trade: Double position size (0.1 → 0.2 → 0.4 lots)</li> <li>After a losing trade: Return to base position size (0.1 lots)</li> <li>Set a maximum position size: 0.8 lots (or use the number of consecutive wins)</li> <li>Create a journal in your trading plan to record notes during trading sessions</li> </ul> <h4>Step 3: Identify Favorable Market Conditions</h4> <p>ThinkMarkets' advanced charting package helps identify strong trends in your chosen FX pair. For example, you can validate the strength of a breakout during a EUR USD trend with increasing volume and the use of trend indicators. The <a href="/en/trading-academy/indicators-and-patterns/atr-indicator/">Average True Range (ATR)</a> can confirm a downtrend or uptrend in Forex before entry.</p> <h4>Step 4: Execute Your Initial Trade</h4> <p>Using ThinkMarkets' trading platform, ThinkTrader:</p> <ul> <li>Select EUR/USD from the currency pair list</li> <li>Set your order type to "Market" or "Limit", depending on your entry strategy</li> <li>Enter your base position size (0.1 lots)</li> <li>Set your stop-loss 50 pips below entry (for buy orders)</li> <li>Set your take-profit 100 pips above entry (2 to 1 risk to reward ratio)</li> <li>Utilise the platform's "Long Position" order feature to link these orders automatically</li> </ul> <p><img alt="Buy EURUSD Reverse Martingale Trade - ThinkMarkets" src="/getmedia/c7469f74-318b-423e-92b7-6023ec0fea1b/Academy-Forex-EURUSD-RM-Long-Position.png" /></p> <p style="text-align: center;">EURUSD Long Position, First Reverse Martingale Order</p> <h4>Step 5: Apply Your Position Sizing Strategy After Results</h4> <p>When your trade concludes:</p> <ul> <li>If profitable: Open ThinkMarkets' order ticket and double your position size to 0.2 lots for the next trade</li> <li>If loss occurs: Reset to your base 0.1 lot position size in the order ticket</li> <li>Use ThinkMarkets' position size calculator to verify that your risk percentage remains within acceptable limits</li> </ul> <h4>Step 6: Utilise ThinkMarkets' Automated Trade Management</h4> <p>As you progress through winning trades and larger positions:</p> <ul> <li>Implement ThinkTraders' partial close feature to secure profits on half your position when price moves 50% toward your target</li> <li>Apply trailing stops using the platform's automated trailing stop function</li> <li>Set price alerts to notify you of potential entry and exit points</li> </ul> <h4>Step 7: Optimise Using ThinkMarkets' Advanced Features</h4> <p>Fine-tune your Reverse Martingale implementation by:</p> <ul> <li>Backtesting your specific parameters using ThinkMarkets' Traders Gym</li> <li>Analysing performance metrics in the platform's trading analytics dashboard</li> <li>Setting up custom indicators that align with your Reverse Martingale entry criteria</li> </ul> <p><img alt="EURUSD Simulation, Reverse Martingale - ThinkMarkets Traders Gym" src="/getmedia/f190efcf-19ba-4c78-9497-b2cd1b93e590/Academy-Forex-Reverse-Martingale-EURUSD-Simulation.png" /></p> <p style="text-align: center;">EURUSD Reverse Martingale Simulation Panel</p> <h2>Conclusion</h2> <p>The Reverse Martingale strategy offers a trading approach to risk management, capitalising on winning streaks rather than trying to recover all previous losses with one trade. It is the opposite of the Martingale and may be more effective in trending following strategies. However, it carries even odds of losing hard-earned profits and increased exposure to market reversals, and traders have difficulties reducing positions after losses.</p> <p>Successful implementation requires discipline, emotional control, and a solid understanding of market dynamics. Traders must be vigilant against overconfidence and maintain strict compliance with predefined rules. While the strategy may offer potential for significant profits, it could lead to substantial losses, as a series of losses can quickly eradicate an account.</p> <p>Continuous education, practice, and adaptation to changing market conditions are essential for long-term success using the Reverse Martingale approach, despite it being assumed a less damaging investment strategy than Martingale.</p> <br /> <br /> <p id="image-footnote-1"><sub>1. This image is a recreation that first appeared on forexop</sub></p>
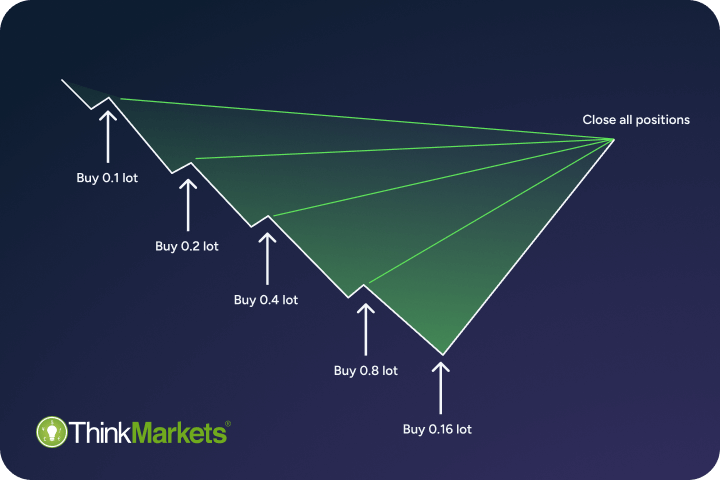
What is Martingale in Trading? How Martingale Strategy Works?
<p>Martingale in trading is a controversial strategy designed to recover several losing trades through a single winning trade.</p> <p>While it may seem appealing at first, the Martingale strategy carries significant risks that aspiring Martingale traders must consider before using it.</p> <p>This article explores how Martingale trading works, its advantages and hidden pitfalls, and some alternative ways to use Martingale in Forex trading.</p> <h2>The Classic Martingale Strategy</h2> <p>The classic Martingale strategy is a risk management technique that originated in 18th-century France as a betting system for binary outcomes, such as coin flips or casino roulette.</p> <p>The core idea of the Martingale system involves double betting after each loss to recover all previous losses and yield a profit equal to the initial stake. The approach assumes that using a doubling strategy behind each loss reduces the chance of continued loss in half every next bet, which creates an illusion of short-term recovery. However, this method falls prey to the gambler’s fallacy—the mistaken belief that past events influence future outcomes.</p> <p>Initially introduced in probability theory by French mathematician Paul Pierre Levy, the Martingale concept was later adapted as a risk management model following the extensive work on martingales and stochastic processes by American mathematician Joseph Leo Doob. Doob refuted the notion of a 100% foolproof Martingale investment strategy.</p> <p>To illustrate the Martingale theorem in practice, consider a simple 50/50 heads-or-tails game. Suppose you start with a $1 stake on heads; if you lose, you double your stake to $2, then to $4 with another loss, and so on.</p> <p><img alt="The Martingale Double-betting Strategy" src="/getmedia/46747186-0c22-4fce-ba22-0db682efa0d1/Academy-Forex-Martingale-The-Martingale-Double-betting-Strategy.png" /></p> <p style="text-align: center;">The Martingale Double-betting Strategy</p> <p>In the example, a final winning trade of $16 would cover all previous losses totalling $15 and yield a $1 profit — the same as the initial stake. However, these infrequent wins in the Martingale strategy obscure the long-term risk of ruin, creating a false parallel between asset price reversals and gambling odds, which contributed to the adoption of Martingale in trading.</p> <h2>Introduction to Martingale in Forex Trading</h2> <p>Although financial markets lack the fixed odds of a traditional betting strategy, the Martingale in Forex trading gained popularity amongst traders in the 2010s thanks to its mechanical appeal and the adoption of the FX market, including the rise of algorithmic and probability trading.</p> <p>One key factor in the prominence of Martingale trading strategies is the availability of smaller lot sizes (mini lots), which enables traders to start with relatively small position sizes and gradually scale up as needed.</p> <p>Another factor is the leverage provided by many Forex brokers. Leverage allows Martingale traders to control larger positions with less capital, making high-risk trading strategies like the Martingale strategy more appealing—though it also magnifies losses.</p> <h2>What is Martingale in Forex Trading</h2> <p>Martingale in Forex trading is essentially a dynamic position sizing strategy based on the theory of mean reversion, which suggests that asset prices tend to return to their average. Traders using a Martingale Forex strategy believe that doubling up behind each loss will facilitate a fast recovery by increasing the odds of a shorter pullback to the mean.</p> <p><img alt="Martingale in Forex - ThinkMarkets" src="/getmedia/b69372e9-1bff-4169-8260-e12d2f84c6a1/Academy-Forex-Martingale-The-Martingale-Process-in-Forex-Trading.png" /></p> <p style="text-align: center;">The Martingale Process in Forex Trading</p> <p>It is important to understand that while a Martingale Forex strategy may offer the potential for recovery through the mean reversion process, it also carries significant risks and can result in substantial losses unless favourable market conditions exist.</p> <h2>Assumptions of Martingale in Trading</h2> <p>Beyond mean reversion, Martingale trading assumes that random, extreme events, such as the February 2025 "DeepSeek" crash, will not occur.</p> <p>It also presumes that prolonged trends in the Forex market are absent since established trends significantly increase Martingale risk.</p> <p>Overall, implementing a Martingale strategy in Forex trading demands a thorough understanding of short — and long-term market trends and overall market efficiency.</p> <h2>How Does the Martingale Strategy Work in Forex</h2> <p>To demonstrate how a Martingale Forex strategy works in trading, the following table outlines the progression of five trades - including lot sizes and performance in account balance money- assuming a starting balance of $1000 with a stop loss and profit target of 50 pips.</p> <p><img alt="Martingale Strategy Forex Example" src="/getmedia/1aa3ee14-5e93-427f-ad9a-0a4598fd6e12/Academy-Forex-Martingale-Martingale-Strategy-Forex-Example.png" /></p> <p style="text-align: center;">Martingale Strategy Forex Example</p> <p>In this example, the Forex trader risks a cumulative total of $750 to secure a $50 profit—15 times the initial risk exposure—after enduring four consecutive trades with equidistant losses. This four-trade losing streak represents 75% of the starting balance, explaining why many traders deplete their accounts before achieving a win.</p> <p>In a Martingale layer strategy, if a long position encounters five consecutive adverse moves, the trader doubles the lot size after each fixed pip drop loss. For example, the lot size might double from 0.1 lots to 1.6 lots after four consecutive losses of 20 pips each.</p> <p><img alt="Martingale Trading Strategy (Martignale Layer) - ThinkMarkets" src="/getmedia/cf2a9e44-41c1-40b5-a665-a6ea9e6e6edb/Academy-Forex-Martingale-Martingale-Strategy-Example-Martingale-Layer.png" /></p> <p style="text-align: center;">Martingale Strategy Example (Martingale Layer)</p> <h2>EUR/USD Martingale Strategy Example</h2> <p>To illustrate how Martingale trading strategies work in the FX market, consider a scenario with the EUR/USD currency pair during a period of a sideways market. It is important to mention that when traders use the Martingale strategy on liquid pairs like EUR/USD, they can open and close positions smoothly during a series of losses.</p> <p>Suppose a Forex trader notices that EUR/USD has fluctuated between 1.0500 and 1.0460 (a 40-pip range) for several hours, with no clear trend emerging and a flat moving average. Believing that this range-bound behaviour will persist, the trader enters the market by buying 0.1 lots of EUR/USD at 1.0460.</p> <p>The trade is held without a set profit level in anticipation of a breakout. However, when the trade turns unfavourable below the upper band, the trader implements a Martingale layer strategy and doubles down every 40 pips (40-pip layer).</p> <p>The price slides 40 pips below entry at 1.0420, and the trader enters a long position at 0.2 lots, twice the original trade size of the first bet.</p> <p>Following the strategy, the Martingale trader doubles the position size to 0.4 lots and buys again at 1.0380 after another breakdown. Although the price continues to fall, it does not reach the next layer at 1.0340 (which would trigger a 0.8 lot position).</p> <p>Finally, when the price reverses 40 pips to 1.0420, the trader closes all positions for a profit. (For simplicity, this example assumes no commissions or spreads.)</p> <p><img alt="Martingale Strategy Chart, EUR/USD Trade" src="/getmedia/e2f298bb-b0b4-4a5d-95d3-f620bf1ab784/Academy-Forex-Martingale-Strategy-Chart-EURUSD-Trade.png" /></p> <p style="text-align: center;">Martingale Strategy Chart, EUR/USD Trade</p> <p>In this example, the trader successfully implements a Martingale Forex strategy. However, had the price fallen another 91 pips, the risk would have increased to $728, double the size of the previous loss.</p> <p><img alt="Martingale Positioning Strategy, Long EURUSD" src="/getmedia/6c09a52a-c6af-472f-9520-1a4bff667de7/Academy-Forex-Martingale-Martingale-Positioning-Strategy-Long-EURUSD.png" /></p> <p style="text-align: center;">Martingale Positioning Strategy, Long EURUSD</p> <p>This is why the Martingale system is a system that requires carefully calibrated stop-loss and take-profit levels to manage risk.</p> <h2>Risks and Drawbacks of Using Martingale in Trading</h2> <p>Although the Martingale strategy can work in theoretical examples, several constraints exist in real-time applications. Below, we expand on the key risks and drawbacks.</p> <h3>Exponential Losses</h3> <p>The biggest risk of using Martingale in trading is the risk of ruin from exponential losses, which becomes more likely when the number of consecutive losses grows.</p> <p>Doubling down after each loss in previous trades can quickly increase the required capital to the point of no return.</p> <p>Here's an example showing how quickly losses can accumulate using the Martingale strategy.</p> <h4>Martingale Strategy Example of 10 Consecutive Losses</h4> <p>For example, consider a Martingale trade with an initial size of $100. The sequence of consecutive losses would look as follows:</p> <p><img alt="Martingale Losing Streak Example" src="/getmedia/bdcc21bb-b845-410b-91b6-72d016daefb3/Academy-Forex-Martingale-Martingale-Losing-Streak-Example.png" /></p> <p style="text-align: center;">Martingale Losing Streak Example</p> <p>After 10 consecutive losing trades, the cumulative losses would amount to a staggering $102,400, with the required lot size ballooning to 102.4 or a 1000-fold over the initial capital.</p> <p>Even a $100 stake would still require $1,600 by the fifth loss, showing how quickly a string of consecutive losses can lead to a negative balance.</p> <h3>Psychological Pitfalls from Chasing Losses</h3> <p>Another drawback of using a Martingale strategy is the psychological trap of chasing losses. As traders double their position sizes after each loss, they may become emotionally attached and make irrational decisions. The psychological pressure of realised losses can lead to revenge trading, which can result in additional capital loss.</p> <h4>Trading Costs and Spreads</h4> <p>Another reality of Martingale trading is the impact of transaction costs and spreads. Even if a trader recovers losses, the additional costs from multiple trades can erode profits or exacerbate losses, especially when one trades in volatile markets.</p> <h2>Why Traders Use Martingale in Forex?</h2> <p>While Martingale trading strategies carry significant risks, many traders keep using the Martingale strategy in Forex due to its potential benefits. Here are the key advantages:</p> <h3>Ability to Recover Losses Fast</h3> <p>A primary advantage of using Martingale in trading Forex is its (therotical) ability to fully recover from successive losses on a single winning trade. Martingale Forex strategies also offer some traders a structured approach to position sizing.</p> <h3>Trader Profile and Psychology</h3> <p>The potential for a quick recovery can particularly appeal to risk-tolerant traders who prefer aggressive day trading strategies and larger trade sizes. Overconfidence and an illusion of control over market outcomes may also drive some traders to adopt Martingale in Forex trading, as they believe they can effectively manage the risks associated with the strategy.</p> <h3>Works in Certain Market Conditions</h3> <p>Martingale trading strategies can appear profitable in the short term under specific conditions. Traders may initially have a good success rate with the strategy, which may reinforce their belief in its effectiveness. Some Martingale traders also use the Martingale system in combination with technical analysis and other trading strategies, such as the Martingale Fibonacci, to mitigate risks.</p> <h2>Is Martingale Trading Right for You?</h2> <p>Deciding whether the Martingale suits your trading style requires carefully weighing the potential benefits against the significant risks involved. While Martingale trading strategies may offer a quick recovery from losses and the possibility of returns under certain market conditions, they also carry a risk of ruinous losses and account depletion.</p> <h3>Pros and Cons of Martingale Trading</h3> <p>Before implementing this strategy, traders should assess their risk tolerance, trading experience, and financial capacity to withstand potential drawdowns.</p> <p><img alt="Martingale Trading Pros and Cons" src="/getmedia/622c11b2-e834-4e47-a14d-415a19a535be/Academy-Forex-Martingale-Martingale-Trading-Pros-and-Cons.png" /></p> <p style="text-align: center;">Martingale Trading Pros and Cons</p> <h2>Risk Management for Martingale Trading</h2> <p>Martingale in Forex trading poses high risks. Traders who choose to use it must adhere to strict risk management practices to mitigate potential losses and should consider risk management techniques:</p> <ul> <li>Proper Position Sizing: Start with small position sizes and set a maximum limit on the number of times you are willing to double your positions.</li> <li>Implement Strict Stop-Loss Orders: Set predetermined exit points for trades to cap potential losses and protect against ruinous drawdowns.</li> <li>Fixed Fractional Risk Management: Risk a fixed percentage of your account balance on each Martingale trade with a maximum stop loss percentage or trade loss.</li> <li>Diversify Across Assets: Spread your risk across multiple currency pairs or even different asset classes to help reduce the impact of adverse price movements.</li> <li>Hedge with Correlated Pairs: Use correlated currency markets to provide additional protection against potential losses.</li> <li>Monitor Markes: Continuously monitor market conditions and be prepared to abandon the strategy if a clear trend emerges.</li> <li>Asset Selection: Major currency pairs (EUR/USD, GBP/USD) offer perceived stability vs volatile assets.</li> </ul> <h2>Alternatives to the Martingale Forex Strategy</h2> <p>Also known as the anti-Martingale strategy, the reverse Martingale strategy involves doubling position sizes after winning trades rather than losing trades and reducing them after losing trades. This method of investing seeks to capitalise on winning streaks while limiting exposure during losing periods.</p> <h3>Reverse Martingale Strategy</h3> <p>Also widely known as the anti-Martingale strategy, the reverse Martingale strategy involves doubling up position sizes after winning trades and not after losing ones while reducing sizes after losing trades. This method of investing seeks to take advantage of winning streaks and potentially limit exposure during periods of loss.</p> <p><img alt="Martingale vs Reverse Martingale Performance" src="/getmedia/5d0a77f5-d4ce-4854-93a1-88dd7cc3563c/Academy-Forex-Martingale-Martingale-vs-Anti-Martingale-Strategy-Performance.png" /></p> <p style="text-align: center;">Martingale vs Reverse Martingale Performance</p> <h3>Pyramid Martingale</h3> <p>The Pyramid Martingale works in a similar way to the anti-Martingale trading strategy, with the fundamental difference being the addition of the initial stake to winning trades and not losing ones. This method exploits momentum, following the "let winners run" philosophy.</p> <h3>Trend Following</h3> <p>This variation of the Martingale Forex strategy focused on identifying and capitalising on established market trends by trading with the prevailing market direction, potentially reducing the frequency of losing trades. For example, traders might use Martingale long positions during pullbacks in an upward trend.</p> <h4>Strategy Comparison Mix Based on Statistics</h4> <p><img alt="Martingale Trading Strategies" src="/getmedia/bd991819-babf-47cd-b238-f9c984d9e7d1/Academy-Forex-Martingale-Martingale-Trading-Strategies.png" /></p> <p style="text-align: center;">Martingale Trading Strategies</p> <h2>Conclusion</h2> <p>The use of Martingale in trading carries a high degree of risk that traders must carefully consider before use.</p> <p>While it has the potential to recover losses quickly, a Martingale Forex strategy relies on the assumption of mean reversion and favourable market conditions, which can lead to exponential losses during prolonged losing streaks or trending markets.</p> <p>Aspiring Martingale traders must also prepare psychologically. Although the Martingale approach offers a structured method for position sizing and the potential for fast recovery, it is not suitable for everyone.</p> <p>Traders considering using Martingale in trading should assess their risk tolerance, trading experience, and financial capacity to endure substantial drawdowns.</p> <p>For those who find it unsuitable, alternative strategies, such as the anti-Martingale, pyramid Martingale and trend following Martingale, may offer more sustainable long-term results.</p> <p>Ultimately, Martingale traders must balance the potential benefits of Martingale in Forex against its significant risks and adhere to strict risk management practices.</p>
How to use the Ichimoku Cloud
<p>An increasing number of beginner traders wonder how to use the Ichimoku Cloud, drawn by the distinctive visuals and all-in-one nature of the technical indicator.</p> <p>The comprehensive Ichimoku Kinko Hyo Cloud integrates several components and requires a nuanced understanding to interpret correctly.</p> <p>Although it can be intimidating at first, understanding how the Ichimoku lines work together can help traders make trading decisions more easily and achieve greater consistency.</p> <p>This article is here to help traders gain a nuanced understanding of <a href="/eu/trading-academy/technical-analysis/how-to-trade-markets/">how to use the Ichimoku Cloud to trade</a> forex pairs and other markets.</p> <p>Those with a burning desire to improve their trading strategies or quit juggling various indicators may consider the Ichimoku Cloud becoming a powerful technical trading tool in their arsenal.</p> <p>By the end, aspiring Ichimoku traders should be able to add the indicator to their MT4 or <a href="/en/trading-academy/tradingview/how-to-use-tradingview-charts/">TradingView price charts</a> and identify potential trading opportunities more easily than before.</p> <h2>What is the Ichimoku indicator?</h2> <p>The Ichimoku Cloud is a powerful <a href="/eu/trading-academy/indicators-and-patterns/technical-indicators-beginners-guide/">technical indicator</a> originating from Japan that is used in forex trading and other financial markets.</p> <p>Developed and refined over decades before its release, it is renowned for its ability to encapsulate at a single glance multiple aspects of market dynamics, such as trends and support and resistance, into a visually intuitive chart.</p> <p>The Ichimoku Cloud translates to "one glance equilibrium chart" in Japanese.</p> <p>The all-in-one indicator forms a distinctive 'Cloud' shape, also known as Kumo Cloud, formed by the Senkou Span A-B area. The Cloud trading system incorporates five moving average variants for a holistic view of the market:</p> <ul> <li>Conversion Line (Tenkan Sen)</li> <li>Base Line (Kijun Sen)</li> <li>Leading Span A (Senkou Span A)</li> <li>Lagging Span B (Senkou Span B)</li> <li>Lagging Span (Chikou Span)</li> </ul> <p><img alt="Ichimoku Cloud ThinkMarkets" src="/getmedia/7e0b16b0-c9e5-4d54-9676-02ed3e781f4c/Academy-Tech-analysis-Ichimoku-Cloud.png" /></p> <p style="text-align: center;">The Ichimoku Cloud</p> <p>As a dynamic indicator consisting of multiple parts, trading Ichimoku can help traders identify sell or buy signals for both short-term and long-term trades. While it is popular for its effectiveness in trending markets, it has earned its reputation as a reliable tool for novice and experienced traders alike in various market conditions.</p> <h2>History of the Ichimoku Kinko Hyo Cloud</h2> <p><a href="/en/trading-academy/indicators-and-patterns/ichimoku-kinko-hyo-cloud-trading-indicator/">The Ichimoku indicator</a> was developed before World War II by Japanese journalist Goichi Hosoda. Dissatisfied with the limitations of traditional Japanese charts, Hosoda sought to create a trading system that could better help analyse market trends by incorporating multiple time frames and equilibrium points.</p> <p>After spending nearly 30 years refining the Ichimoku Cloud strategy, he introduced the Ichimoku Kinko Hyo original book to the world in 1968. The book quickly gained popularity in Japan and became a standard tool in many trading rooms.</p> <p>The Ichimoku kinko hyo system began to attract attention in the West in the 1990s, with key figures like Hidenobu Sasaki and David Linton helping to popularise it through books and teachings.</p> <p>Following its incorporation into trading software and platforms like MT4 and TradingView, the Ichimoku Cloud indicator remains a cornerstone of technical analysis today, particularly in <a href="/eu/trading-academy/forex/what-is-forex-trading/">forex trading</a>.</p> <h2>How does Ichimoku Cloud work?</h2> <p>The Ichimoku indicator works by combining multiple moving average variants into a single, easy-to-read chart. Rather than focusing on just one or two averages for crossovers, it uses five lines that provide information on momentum, equilibrium, and even projected support and resistance. This offers any trader a view of past, present, and potential future price action.</p> <p>When these five lines are viewed together, they can reveal whether the price is in an uptrend or downtrend, where key support and resistance may lie, and even the balance of supply and demand.</p> <p>The Ichimoku Cloud settings are known as 9 26 52 26, where the Tenkan Sen is 9 periods, the Kijun Sen is 26 periods, the Senkou Span A is 26 periods, the Senkou Span B is 52 periods, and the Chikou Span is 26 periods (seen in the below TradingView chart - top to bottom).</p> <p><img alt="Ichimikou cloud default settings ThinkMarkets" src="/getmedia/734a8f72-20b3-47fe-a7c1-94b2adde191a/Academy-Tech-analysis-Ichimoku-Cloud-default-settings-TradingView.png" /></p> <p style="text-align: center;">Ichimoku Cloud default settings, TradingView</p> <p>Although originally derived from the Japanese trading calendar, the majority of Ichimoku strategies continue to utilise these settings to date because they have been rigorously tested over decades. Some traders may adjust them to suit different markets or trading styles. However, doing so may reduce the Ichimoku win rate due to widely accepted interpretations.</p> <h2>How to interpret Ichimoku Cloud</h2> <p>Designed to capture markets' equilibrium from three distinct time periods, the fast-acting line (the Tenkan-Sen) has a role in capturing near‐term momentum.</p> <p>As the Ichimoku components work together, a slower, more stable line (the Kijun-Sen) outlines the medium-term trend and acts as a dynamic benchmark for support or resistance.</p> <p>Two forward‐projected lines (Senkou Span A and Senkou Span B) form the Kumo Cloud, which forecasts future price movement and provides a picture of the trend’s duration.</p> <p>Complementing these, a backwards-looking line (the Chikou Span) traces the current price into the past, providing retrospective confirmation of trend strength.</p> <p>The table below summarises each component’s period, trend duration focus, and primary role.</p> <p><img alt="How to interpret Ichimoku Cloud" src="/getmedia/28e99a34-7eef-4ccc-b8ac-d962fefea6c4/Academy-Ichimoku-cloud-Reverse-Martignale-vs-Clasic-Martingale-table.png" /></p> <h2>Ichimoku Cloud explained</h2> <h3>Tenkan-Sen: The Conversion Line</h3> <p>The Conversion Line, or Tenkan-Sen, is a short-term moving average that represents the midpoint of the highest high and lowest low over the past 9 periods to help identify short-term trends and potential reversal points. This construction gives it a dual role: it reacts quickly to short‐term price extremes while also identifying early signs of momentum shifts.</p> <p>When the price is above the Tenkan-Sen, it indicates a potential bullish trend, while a cross below suggests a bearish trend. The steeper the angle, the stronger the momentum. On the other hand, a flat Tenkan-Sen indicates a trendless condition over the last 9 periods.</p> <h3>Kijun-Sen: The Base Line</h3> <p>The Base Line, or Kijun-Sen, is a longer-term moving average that provides a broader view of market trends as it is calculated by averaging the highest high and lowest low over the past 26 periods. It is more reliable for medium-term price equilibrium due to the longer time period than the Tenkan-Sen and can be used to confirm shorter-term trends identified by the shorter-term line.</p> <p>When the price crosses above the Kijun-Sen, it indicates a potential bullish trend, while a cross below suggests a bearish trend. However, the price will often oscillate around the Kijun-Sen, with rebounds towards it underscoring its role as a gravitational “anchor.”</p> <h3>Senkou Span A: Leading Span A</h3> <p>Leading Span A, or Senkou Span A, is calculated by averaging the Kijun-Sen and Tenkan-Sen and plotting it 26 periods into the future. This forward shift represents potential future support and resistance levels ahead of current price action at a dynamic level, forming the upper cloud boundary of Kumo.</p> <p>Senkou Span A is useful for identifying areas where the trend may continue or a potential trend reversal may occur. When the price is above the Senkou Span A line, it implies a bullish trend, while a price below indicates a bearish trend. When it is combined with Senkou Span B, it helps reveal a forward-looking equilibrium.</p> <h3>Senkou Span B: Leading Span B</h3> <p>Leading Span B, or Senkou Span B, is calculated using the average of the highest high and lowest low of the past 52 periods and producing the line 26 periods into the future. Because it reflects a much longer historical range, Senkou Span B tends to move more slowly. This Ichimoku component provides a broader view of near-term market extremes at a dynamic level, forming the lower Cloud border.</p> <p>Span B is useful for identifying areas where the trend may continue or reverse. When the price is above Leading Span B, it indicates a bullish trend, while a price below suggests a bearish trend.</p> <h3>Chikou Span: The Lagging Span</h3> <p>The Lagging Span, or Chikou Span, represents the current price at the bar close plotted 26 periods behind, effectively offering a confirmation of current market sentiment. This line helps confirm price action, potential bearish and bullish trend reversal points and trend direction and strength.</p> <p>The Chikou Span is a unique component of the Ichimoku Cloud, providing a historical perspective on the current price action and allowing traders to see whether current price moves are in line with the longer-term trend. It sits at the left, backwards-looking side of the Ichimoku Kinko Hyo chart.</p> <p>When the Chikou Span rests above the past price action, it reinforces bullish momentum, while a lag below historical prices confirms bearish conditions.</p> <h3>Kumo Cloud</h3> <p>The Ichimoku Kumo Cloud is the area between Senkou Span A and B. It provides a multidimensional view of dynamic support and resistance levels and helps identify trend direction.</p> <p>In a generic interpretation, when the price is above the Kumo Cloud, it indicates a bullish trend, while a price below suggests a bearish trend. However, when the two leading spans change their relative positions (one crosses the other), it signals potential shifts in market sentiment and trend reversals. This event is known as the Kumo Twist.</p> <p>The thickness of the cloud and even its colour (often changed automatically based on which Span is on top, from green cloud to red cloud and vice versa) can help measure the strength of the reverting or prevailing trend.</p> <p>For context, after a Kumo Twist, the Cloud is usually thin because it is in the early stages of forming a new dynamic support and resistance region. This suggests a weak or consolidating trend that may still be predisposed to reversals or breakouts. On the other hand, a thick, or thickening, ongoing Kumo tends to act as a strong activation barrier, making cloud breakouts more difficult.</p> <p><img alt="Ichimoku Cloud Uptrend Downtrend ThinkMarkes" src="/getmedia/551a18b9-8c7d-4a68-a989-23b5b3f2b23a/Academy-Tech-analysis-Ichimoku-Cloud-bullish-trend-and-bearish-trend.png" /></p> <p style="text-align: center;">Ichimoku Cloud bullish trend and bearish trend</p> <h2>Ichimoku Cloud trading signals</h2> <p>The Ichimoku Cloud is a technical tool that provides several trading signals derived from its several components, as explained above. Each plays a part in generating potential buy or sell signals.</p> <p><img alt="Ichimoku Cloud trading signals" src="/getmedia/4d011018-d708-400e-9496-8e05b78aa8ae/Academy-Ichimoku-cloud-Reverse-Martignale-vs-Clasic-Martingale-table2.png" /></p> <h2>How to use the Ichimoku indicator for advanced traders</h2> <p>The primary uses of the Ichimoku components are to provide a snapshot of how strong a trend is and to flag potential reversals through its multi‐component interplay. However, since the entire system depends on how price moves, affecting each line, advanced Ichimoku traders can use the trading indicator in other ways to gain additional insights.</p> <h3>Identifying false signals with Ichimoku</h3> <p>While the Ichimoku Cloud is a powerful tool, it can also generate false signals. To identify false signals, traders may look for:</p> <ul> <li><strong>Momentum:</strong> A valid bullish signal typically shows a price close well above the Kumo Cloud and a bearish signal well below it. The bullish signal may be false if the Ichimoku setup is upward, but the price flatlines near the cloud.</li> <li><strong>Precedence:</strong> A strong trend usually sees the fast Tenkan‐Sen above the slower Kijun‐Sen for bullish markets or the opposite for bearish. A simple yet effective Chikou Span strategy is to confirm the trend sits on the “correct” side of historical price action.</li> <li><strong>Consistency:</strong> A valid trading signal on a shorter timeframe (e.g., a 1‑hour chart) should be supported by the overall direction seen on a higher timeframe (e.g., a 4-hour or daily chart). Discrepancies suggest a short‐term fluctuation, not a new trend.</li> </ul> <p>False signals are a common challenge in trading Ichimoku, and using complementary <a href="/eu/trading-academy/technical-analysis/what-is-technical-analysis-in-trading/">technical analysis</a> tools can help traders distinguish between genuine trading signals and market noise. After all, a truly valid signal is accompanied by harmony among its components and others'.</p> <h3>Trading Ichimoku Cloud with other indicators</h3> <p>Incorporating indicators like RSI, MACD, and Bollinger Bands in an Ichimoku Cloud trading strategy can help improve accuracy and reliability. Trading the Ichimoku Cloud with other indicators can provide additional layers of confirmation and may improve overall trading performance.</p> <p>Below are three popular combinations for Ichimoku Cloud trading.</p> <h4>How to use the Ichimoku Cloud with RSI</h4> <p>The Ichimoku RSI strategy can help confirm the strength of trends indicated when trading the Ichimoku Cloud. When the price is trading well above the Cloud, and key Ichimoku lines Tenkan Sen and Kijun Sen are supportive, an RSI cross above the 50 key level signals a stronger indication of entering a long position.</p> <p><img alt="Ichimoku RSI Strategy ThinkMarkets" src="/getmedia/b38e6844-faa4-42c1-8531-e8dd72fd1f9e/Academy-Tech-analysis-Ichimoku-Cloud-with-RSI.png" /></p> <p style="text-align: center;">Ichimoku Cloud with RSI</p> <h4>How to use Ichimoku Cloud and MACD</h4> <p>The Ichimoku and MACD strategy can help confirm the continuation of trends and potential reversal points when the MACD starts to diverge from the Ichimoku signals. Pairing Ichimoku with the MACD reinforces a bullish trend when the MACD line crosses above its signal line at or just before a confirmed bullish Ichimoku setup.</p> <h4>How does Ichimoku Cloud work with Bollinger Bands</h4> <p>The Ichimoku Bollinger Bands strategy can be used to gauge market volatility and identify potential breakouts when the price is above the Cloud or below. For example, when the price breaks above the upper Bollinger Band while trading above the Cloud, it indicates a breakout less likely to fail. However, incorporating the Bands onto the same chart could clutter the trader's view, with many traders choosing separate sub-charts.</p> <h3>Determining entry and exit points with Ichimoku Cloud</h3> <p>The Ichimoku Cloud can help determine optimal entry and exit points for both crossover and breakout signals. Breakout entries are particularly powerful when a period of consolidation ends, often signalled by a wider Kumo Cloud.</p> <h4>How to use the Ichimoku Cloud for entries</h4> <p>For bullish trades, one of the Ichimoku strategies is to enter a long position when the price crosses above the Tenkan Kijun lines, ideally in conjunction with a bullish crossover and a breakout above the Cloud.</p> <p>For bearish trades, a sell signal is reinforced when the price falls below both lines. The Tenkan-Sen crosses below the Kijun-Sen line, and the price is below the Cloud.</p> <p>The Tenkan Sen Kijun Sen strategy is the easiest and <a href="/eu/trading-academy/forex/popular-forex-trading-strategies/">most popular</a> to comprehend, mirroring moving average crossovers.</p> <h4>Ichimoku Strategy for exiting positions</h4> <p>For exits, the Cloud acts as a dynamic support or resistance depending on the direction of the trade.</p> <p>In a long position, if the price starts to pull back towards the lower edge of the cloud or a bearish crossover occurs, it may signal a weakness in price momentum, prompting an exit.</p> <p>Similarly, in a short position, as the price approaches the upper boundary of the Cloud or a bullish crossover develops, calls for an exit.</p> <h3>Managing Cloud trading risk with Ichimoku</h3> <p>Trading Ichimoku Kinko Hyo Cloud requires managing risk, and many Ichimoku strategies are used to help <a href="/eu/trading-academy/forex/position-sizing-guide/">calibrate stop-losses and profit-take targets</a>.</p> <p>For example, a stop-loss for a bullish trade could be placed below the lower boundary of the Cloud, while a take-profit would be set at the Senkou Span A or B, assuming these lines have historically acted as a level of resistance.</p> <p>Many Ichimoku strategies involve the Cloud. A thick cloud plays a key role here as a well-established support or resistance area is less likely to be penetrated, providing traders with more confidence to remain in the market. Conversely, a thin cloud suggests weakness, calling for more conservative positioning, a tighter stop-loss and a shorter profit-take target. Given the reduced risk-reward ratio, narrow clouds are best left without a trade unless using a consolidation trading strategy.</p> <p>To refine risk management, one can also use an average crossover strategy of Ichimoku lines as confirmation signals. For example, a bullish Tenkan-Sen and Kijun-Sen crossover when prices are well above a thick Kumo Cloud supports a strong uptrend and may justify moving the protective stop-loss closer to the entry to secure a profit. On the other hand, a crossover when the two cloud boundaries are thin may signal a faltering trend, suggesting tighter risk parameters and an early exit.</p> <h2>How to use Ichimoku Cloud for day trading with volumes</h2> <p>Day trading with the Ichimoku Cloud involves identifying short-term trends and potential entry and exit points within a single trading day to capture intraday volatility.</p> <p>By combining volume and Ichimoku Cloud analysis, day traders can leverage the Ichimoku Cloud for trend identification and potential breakout zones, as volume confirms the strength and validity of the Ichimoku signals.</p> <p>Here's a step-by-step example of a day trading breakout strategy based on the Ichimoku and volumes on the 1H chart:</p> <ul> <li><strong>Analyse the main trend:</strong> Start by analysing the overall trend on the 4-hour and daily charts. The Ichimoku indicates a trend above or below the Cloud while increasing volumes support it. All timeframes must point in the same direction.</li> <li><strong>Identify the 1-hour trend:</strong> Look for the price to be above the Kumo Cloud and the Tenkan-Sen line to be above the Kijun-Sen for a bullish trend or below the Cloud for a bearish trend.</li> <li><strong>Confirm the 1-hour trend:</strong> Ensure the Chikou Span is above the Cloud for additional confirmation of bullish momentum or below the price for a bearish trend.</li> <li><strong>Confirm breakout with volume:</strong> Look for significant volume spikes during price breakouts above or below the Kumo Cloud to validate the signal. Price closes above or below the Cloud with high volumes indicate a strong up- or downward trend.</li> <li><strong>Consider a position:</strong> Consider entering a long position when the price crosses above the Cloud with high volume. The Tenkan-Sen is also above the Kijun-Sen line, and the Chikou Span is above the Cloud. The opposite setup is valid for shorts in a bearish breakout scenario.</li> <li><strong>Set stop-loss and take-profit:</strong> Consider placing a stop-loss below the Kumo Cloud and a take-profit when prices revert below or above the Kijun-Sen or within the Cloud. Fully exit the trade if the price crosses Kumo in the opposite direction or if volume starts to decline and then increases in the opposite direction. Trades also combine Ichimoku with Fibonacci to evaluate take-profit levels.</li> </ul> <p><img alt="Ichimoku Cloud Day Strategy ThinkMarkets" src="/getmedia/c5651444-8d72-4853-a89c-4a8d86e78e71/Academy-Tech-analysis-Ichimoku-and-volumes-day-trading-strategy.png" /></p> <p style="text-align: center;">Ichimoku and volumes day trading strategy</p> <h2>Ichimoku tips</h2> <p>Ichimoku isn’t just a set of lines; it’s a complete set or Ichimoku components featuring an integrated equilibrium chart that offers a clear view of trend, support and resistance “at a glance.” Learning is all about understanding the bigger picture.</p> <p>Here are some tips and tricks to understanding the Ichimoku:</p> <ul> <li>Familiarise with its five lines at the time-tested standard 9 26 52 settings</li> <li>Pay attention to how the price relates to the Kumo cloud; does it confirm or invalidate the prevailing trend?</li> <li>Anticipate Tenkan-Singou crossovers as they can indicate early entries or warning signs, especially when confirmed by the position of the Chikou Span.</li> <li>Observe the cloud’s thickness; thinner clouds suggest impending breakouts.</li> <li>Embrace multiple time frame analyses, back-testing and other indicators for improved cloud trading strategies.</li> </ul> <p>In short, keep it simple, practice regularly, and let the visual clarity of Ichimoku guide you to informed trading decisions.</p> <h2>Conclusion</h2> <p>The Ichimoku Cloud is a comprehensive indicator and technical analysis tool that provides valuable insights into market trends, support and resistance levels, and potential entry and exit points. By understanding how to use the Ichimoku Cloud components or how to combine them effectively, traders can make more informed decisions and optimise their trading strategies. The Ichimoku Cloud is a technical analysis indicator valuable to the trading arsenal of both a beginner and intermediate trader.</p>
Position sizing: The definitive guide for forex traders
<p>Effective position sizing is an important part of successful Forex trading. It determines how much capital you allocate to each trade, balancing potential rewards with acceptable levels of risk.</p> <p>In this definitive guide to position sizing, we will explore lot size calculators. We will also give insights that might help you improve your trading performance.</p> <h2>Understanding position sizing in forex trading</h2> <p>Position sizing is the process of deciding how much currency to buy or sell in a forex trade. It is not just about entering the market. It is about doing it with a calculated risk that fits your trading plan and risk tolerance.</p> <p>By managing your position sizes well, you can protect your trading capital from large losses. This also might help you increase your chances of steady gains over time.</p> <h2>The importance of lot sizes</h2> <p>In forex trading, currencies are traded in specific quantities known as lots. A lot represents a standardised quantity of the base currency in a currency pair.</p> <p>Understanding lot sizes is important because it affects the value of each pip movement. This, in turn, impacts your potential profit or loss.</p> <h3>Types of Lot Sizes</h3> <ul> <li><strong>Standard:</strong> This is the equivalent of 100,000 units of the base currency. For example, trading one standard lot of EUR/USD means you're buying or selling 100,000 euros.</li> <li><strong>Mini:</strong> Represents 10,000 units of the base currency. Trading a mini lot allows traders with smaller accounts to participate in the market.</li> <li><strong>Micro:</strong> Equal to 1,000 units of the base currency, micro lots provide even greater flexibility and lower risk exposure.</li> <li><strong>Nano:</strong> Some brokers offer nano lots. These are 100 units of the base currency. They help traders who want to start with a small investment.</li> </ul> <p>Understanding these lot sizes helps you tailor your trades according to your account size and risk management strategy.</p> <h3>Calculating position size</h3> <p>Calculating the correct position size is essential for effective risk management. To do this manually, you need to consider several factors:</p> <ul> <li><strong>Account balance:</strong> The total amount of capital in your trading account.</li> <li><strong>Risk percentage per trade:</strong> The percentage of your account balance you are willing to risk on a single trade, often between 1% and 2%.</li> <li><strong>Stop-loss distance:</strong> The number of pips between your entry price and your stop-loss level.</li> <li><strong>Pip value:</strong> The monetary value of each pip movement for the currency pair you're trading.</li> </ul> <h2>Utilising lot size calculators</h2> <p>Manual calculations are simple, but they can take a lot of time. This is especially true when trading many currency pairs with different pip values. This is where a lot size calculator becomes invaluable.</p> <p>A forex lot size calculator simplifies the process by automatically computing the optimal position size based on your inputs. You enter your account balance, risk percentage, stop-loss distance, and the currency pair you are trading. The calculator does the rest for you.</p> <h3>Benefits of using a lot size calculator</h3> <p>Using a lot size calculator offers several benefits that can enhance your trading experience.</p> <p>It improves accuracy by lowering the chance of calculation errors. This helps avoid unintended risk exposure. It also ensures your trades match your risk management strategy.</p> <p>It also boosts efficiency by saving you time. This lets you focus more on market analysis and trade execution instead of manual calculations.</p> <p>Additionally, it provides convenience by enabling you to easily adjust your calculations for different trades and market conditions.</p> <p>Many online platforms provide free lot size calculators. Some trading platforms even include them directly, making your trading easier.</p> <h3>The role of position size calculators in MT4</h3> <p>MetaTrader 4 (MT4) is one of the most widely used trading platforms in the forex industry. It supports the use of custom indicators and scripts, including the position size calculator MT4 indicator. This tool integrates seamlessly with MT4, providing real-time calculations within the platform.</p> <h3>Advantages of the MT4 position size calculator</h3> <ul> <li>Eliminates the need to switch between different applications or websites. Many online platforms provide free lot size calculators. Some trading platforms even include them directly, making your trading easier.</li> <li>Automatically updates calculations based on live market prices.</li> <li>Allows you to customise settings according to your trading preferences and risk management rules.</li> </ul> <p>To use this feature, search for a forex position size calculator that works with MT4. Download and install it. Then, you can start optimising your trades right from your trading charts.</p> <h3>Developing a position sizing strategy</h3> <p>Creating a robust position sizing strategy is essential for long-term success in Forex trading. It involves more than calculationts – it’s about integrating position sizing into your overall trading plan.</p> <h3>Setting your risk parameters</h3> <p>Determine the percentage of your trading capital you're comfortable risking on each trade. This risk tolerance should reflect your financial goals and psychological comfort with potential losses.</p> <h3>Consistency in application</h3> <p>Apply your risk percentage consistently across all trades. This helps manage overall risk and prevents emotional decisions, especially after a series of wins or losses.</p> <h3>Adjusting for market conditions</h3> <p>While consistency is key, it's also important to consider market volatility. In more volatile markets, you might choose to reduce your position size to account for wider stop-loss distances.</p> <h2>Common mistakes in position sizing</h2> <p>Even experienced traders can fall into pitfalls during position sizing. Being aware of these common mistakes can help you avoid them.</p> <h3>Overleveraging</h3> <p>Using excessive leverage can amplify both profits and losses. Overleveraging happens when traders take on positions that are too big for their account size. This raises the risk of large losses.</p> <h3>Ignoring stop-loss levels</h3> <p>Failing to set or adhere to stop-loss levels can undermine the effectiveness of your position sizing strategy.</p> <p>Always calculate your position size based on a predetermined stop-loss to ensure risk is managed properly.</p> <h3>Emotional trading decisions</h3> <p>Letting emotions dictate your trading decisions can lead to inconsistent position sizes and increased risk.</p> <p>Stick to your calculated position sizes, even after a series of wins or losses, to maintain discipline.</p> <h3>The psychological aspect of position sizing</h3> <p>Effective position sizing not only protects your capital but also has a positive impact on your trading psychology.</p> <p>Knowing that each trade carries a controlled level of risk can reduce stress and help you make clearer, more rational decisions.</p> <p>By avoiding the stress of risking too much on one trade, you can focus on your long-term trading goals. This helps you ignore short-term ups and downs.</p> <h2>Using position sizing in your trading plan</h2> <p>A comprehensive trading plan should include detailed guidelines on position sizing. This plan serves as a roadmap for your trading activities and helps ensure consistency.</p> <h3>Steps to integrate position sizing</h3> <ol> <li>Decide on the maximum percentage of your capital you're willing to risk per trade.</li> <li>Establish rules for calculating position sizes based on different scenarios and market conditions.</li> <li>Use lot size calculators or position size calculator indicators to maintain accuracy.</li> <li>Regularly review your position sizing strategy and adjust it as your account grows or as market conditions change.</li> </ol> <h2>Enhancing your trading performance</h2> <p>To deepen your understanding of position sizing, explore further educational resources such as online courses, webinars, or tutorials. These offer interactive learning opportunities and insights from experts.</p> <p>Check out educational resources designed for platforms. This includes tutorials on using tools like the MT4 position size calculator.</p> <p>Position sizing is an important part of trading forex. It affects how well you manage risk and get steady results.</p> <p>By knowing the importance of lot sizes and using tools like lot size calculators, you can improve your trading. Adding these practices to your trading plan will help you perform better.</p> <p>Successful trading isn't just about making profits; it's also about preserving your capital.</p> <p>Good position sizing helps you trade the markets with confidence. You can be sure that each position fits your risk management plan.</p> <p>Staying disciplined and educating yourself puts you on the path to reaching your trading goals.</p>
What is a pip in forex trading?
<h2>What is a pip?</h2> <ul> <li>A "pip" is the smallest whole increment in any forex pair.</li> <li>For pairs quoted in 3 decimal points a pip increment is based on the second decimal.</li> <li>For pairs quoted in 5 decimal points a pip increment is based on the fourth decimal, like the EUR/USD below.</li> </ul> <p><img alt="pips" src="/TMXWebsite/media/TMXWebsite/pips_1.png" /><br /> </p> <h2>Example</h2> <ul> <li>EUR/USD: A movement from 1.362(9)8 to 1.363(0)8 is a 1 pip move</li> <li>In USD/JPY, a movement from 104.4(7)1 to 104.4(8)1 is 1 pip</li> </ul> <p>So how much is a pip worth? This is determined by the currency of your account, the pair you are trading and the position size of your trade.</p>
Popular Forex Trading Strategies
<p dir="ltr"><strong>Identifying a successful forex trading strategy </strong>is one of the most important aspects of <a href="/en/forex-trading/">currency trading</a>. In general, there are numerous trading strategies designed by different types of traders to help you make profit in the market.<br /> </p> <p dir="ltr">However, an individual trader needs to find the best forex trading strategy that suits their trading style, as well as their risk tolerance. In the end, no one size fits all. <br /> </p> <p dir="ltr">In order to make profit, traders should focus on eliminating the losing trades and achieving more winning ones. Any trading strategy that leads you towards this goal could prove to be the winning one. <br /> </p> <h2 dir="ltr">How to choose the best forex trading strategy</h2> <p dir="ltr">Before we proceed to discussing the most popular forex trading strategies, it’s important that we understand the best methods of choosing a trading strategy. There are three main elements that should be taken into consideration in this process.<br /> </p> <h3 dir="ltr">Time frame </h3> <p dir="ltr">Choosing a time frame that suits your trading style is very important. For a trader, there’s a huge difference between trading on a 15-min chart and a weekly chart. If you are leaning more towards becoming a scalper, a trader that aims to benefit from smaller market moves, then you should focus on the lower time frames e.g. from 1-min to 15-min charts. <br /> </p> <p dir="ltr">On the other hand, swing traders are likely to use a 4-hour chart, as well as a daily chart, to generate profitable trading opportunities. Hence, before you choose your preferred trading strategy, make sure you answer the question: how long do I want to stay in a trade? <br /> </p> <p dir="ltr">Varying time periods (<strong>long, medium, and short-term</strong>) correspond to different trading strategies. <br /> </p> <h3 dir="ltr">Number of trading opportunities</h3> <p dir="ltr">When choosing your strategy, you should answer the question: how frequently do I want to open positions? If you are looking to open a higher number of positions then you should focus on a scalping trading strategy. <br /> </p> <p dir="ltr">On the other hand, traders that tend to spend more time and resources on analysing macroeconomic reports and fundamental factors are likely to spend less time in front of charts. Therefore, their preferred trading strategy is based on higher time frames and bigger positions.<br /> </p> <h3 dir="ltr">Position size</h3> <p dir="ltr">Finding the proper trade size is of the utmost importance.<strong> Successful trading strategies</strong> require you to know your risk sentiment. Risking more than you can is very problematic as it can lead to bigger losses. <br /> </p> <p dir="ltr">A popular piece of advice in this regard is to set a risk limit at each trade. For instance, traders tend to set a 1% limit on their trades, meaning they won’t risk more than 1% of their account on a single trade. </p> <p dir="ltr"> </p> <p dir="ltr"><img alt="Forex trading - ThinkMarkets" src="/TMXWebsite/media/TMXWebsite/3-strategies-image-1.jpg" /></p> <p dir="ltr">For example, if your account is worth $30,000, you should risk up to $300 on a single trade if the risk limit is set at 1%. Depending on your risk sentiment, you can move this limit to 0.5% or 2%. <br /> </p> <p dir="ltr">In general, the lower the number of trades you are looking to open the bigger the position size should be, and vice versa. <br /> </p> <h2>Three successful strategies</h2> <p dir="ltr">By now, you have identified a time frame, the desired position size on a single trade, and the approximate number of trades you are looking to open over a certain period of time. Below, we share three popular forex trading strategies that have proven to be successful. <br /> </p> <h3 dir="ltr">Scalping</h3> <p dir="ltr"><strong>Forex scalping</strong> is a popular trading strategy that is focused on smaller market movements. This strategy involves opening a large number of trades in a bid to bring small profits per each. <br /> </p> <p dir="ltr">As a result, scalpers work to generate larger profits by generating a large number of smaller gains. This approach is completely opposite of holding a position for hours, days, or even weeks. <br /> </p> <p dir="ltr">Scalping is very popular in forex due to its liquidity and volatility. Investors are looking for markets where the price action is moving constantly to capitalise on fluctuations in small increments.<br /> </p> <p dir="ltr">This type of trader tends to focus on profits that are around 5 pips per trade. However, they are hoping that a large number of trades is successful as profits are constant, stable and easy to achieve. <br /> </p> <p dir="ltr">A clear downside to scalping is that you cannot afford to stay in the trade too long. Additionally, scalping requires a lot of time and attention, as you have to constantly analyse charts to find new trading opportunities. <br /> </p> <p dir="ltr">Let’s now demonstrate how scalping works in practice. Below you see the EUR/USD 15-min chart. Our scalping trading strategy is based on the idea that we are looking to sell any attempt of the price action to move above the 200-period moving average (MA). </p> <p dir="ltr"> </p> <p dir="ltr"><img alt="EUR/USD 15-Minute Chart" src="/TMXWebsite/media/TMXWebsite/EUR-USD-chart.jpg" /></p> <p dir="ltr"> </p> <p dir="ltr">In about 3 hours, we generated four trading opportunities. Each time, the price action moved slightly above the 200-period moving average before rotating lower. A stop loss is located 5 pips above the moving average, while the price action never exceeded the MA by more than 3.5 pips. <br /> </p> <p dir="ltr">Take profit is also 5 pips as we focus on achieving a large number of successful trades with smaller profits. Therefore, in total 20 pips were collected with a scalping trading strategy. <br /> </p> <h3 dir="ltr">Day trading</h3> <p dir="ltr"><strong>Day trading</strong> refers to the process of trading currencies in one trading day. Although applicable in all markets, day trading strategy is mostly used in forex. This trading approach advises you to open and close all trades within a single day. <br /> </p> <p dir="ltr">No position should stay open overnight to minimise the risk. Unlike scalpers, who are looking to stay in markets for a few minutes, day traders usually stay active over the day monitoring and managing opened trades. Day traders are mostly using 30-min and 1-hour time frames to generate trading ideas. <br /> </p> <p dir="ltr">Many day traders tend to base their trading strategies on news. Scheduled events e.g. economic statistics, interest rates, GDPs, elections etc., tend to have a strong impact on the market. <br /> </p> <p dir="ltr">In addition to the limit set on each position, day traders tend to set a daily risk limit. A common decision among traders is setting a 3% daily risk limit. This will protect your account and capital.<br /> </p> <p dir="ltr"> </p> <p dir="ltr"><img alt="GBP/USD 1-Hour Chart" src="/TMXWebsite/media/TMXWebsite/GBP-USD-chart.jpg" /></p> <p dir="ltr"> </p> <p dir="ltr">In the chart above, we see GBP/USD moving on an hourly chart. This trading strategy is based on finding the horizontal support and resistance lines on a chart. In this particular case, we are focused on resistance as the price is moving upward. <br /> </p> <p dir="ltr">The price movement tags the horizontal resistance and immediately rotates lower. Our stop loss is located above the previous swing high to allow for a minor breach of the resistance line. Thus, a stop loss order is placed 25 pips above the entry point. <br /> </p> <p dir="ltr">On the downside, we use the horizontal support to place a profit-taking order. Ultimately, the price action rotates lower to bring us around 65 pips in profits. <br /> </p> <h3 dir="ltr">Position trading</h3> <p dir="ltr"><strong>Position trading</strong> is a long-term strategy. Unlike scalping and day trading, this trading strategy is primarily focused on fundamental factors. <br /> </p> <p dir="ltr">Minor market fluctuations are not considered in this strategy as they don’t affect the broader market picture.<br /> </p> <p dir="ltr">Position traders are likely to monitor central bank monetary policies, political developments and other fundamental factors to identify cyclical trends. Successful position traders may open just a few trades over the entire year. However, profit targets in these trades are likely to be at least a couple of hundreds pips per each trade. <br /> </p> <p dir="ltr">This trading strategy is reserved for more patient traders as their position may take weeks, months or even years to play out. You can observe the <strong>dollar index (DXY)</strong> reversing its trend direction on a weekly chart below.</p> <p dir="ltr"> </p> <p dir="ltr"><img alt="DXY - the dollar index weekly chart" src="/TMXWebsite/media/TMXWebsite/USDX-US-Dollar-Index.jpg" /></p> <p dir="ltr"> </p> <p dir="ltr">A reversal is a result of the huge monetary stimulus provided by the US Federal Reserve and the Trump administration to help the troubled economy. As a result, the amount of active dollars increases, which decreases the value of the dollar. Position traders are likely to start selling the dollar on trillion-dollar stimulus packages. <br /> <br /> <br /> Their target may depend on different factors: long-term technical indicators and the macroeconomic environment. Once they believe that the current bearish trend is nearing its end from a technical perspective, they will seek to exit the trade. In this example, we see the DXY rotating at the multi-year highs to trade more than 600 pips lower 4 months later (March - July).<br /> </p> <h2>Summary</h2> <ul dir="ltr"> <li role="presentation">Each trader needs to find the best forex trading strategy that suits their trading style;</li> <li role="presentation">Choose your own trading strategy by finding a preferred time frame, the desired position size and the number of trades you are looking to open;</li> <li role="presentation">Scalping is a popular trading strategy that involves opening numerous trades over a short period of time to capitalise on smaller market movements;</li> <li role="presentation">Day traders tend to open and close all trades within a single day;</li> <li role="presentation">Position trading is reserved for more patient traders with a background in finance and economics as they look to profit from long-term market trends.</li> </ul>
How to Understand Forex Trading Signals
Forex signals are popular with beginner traders to improve their success rate and enrich their trading experience. Trading signals are generated either by a human analyst or trader or an automated platform on a forex signal service. <h2>What are forex signals?</h2> <p dir="ltr">Forex signals serve to <strong>determine the right forex trading opportunities at the right moment.</strong> By its very nature, a forex signal refers to a trading idea centred around a particular <a href="/en/forex-trading/">currency pair</a>, which should be implemented at a predefined price and time. </p> <p dir="ltr">Regardless of your trading expertise, using forex signals can significantly improve your trading performance. Furthermore, expert traders can utilise forex signals to expand their profitability scope and experience. </p> <p dir="ltr">As for novice traders, forex signals offer advantages as they allow them to make a profit while still gaining knowledge about the world of trading with currencies. Using the signals, traders can also speed up the learning process because it helps them gain full insight about which trading options the signal is built on.</p> <p dir="ltr">It’s very important to know that a trading signal is useful only when used at the right time, especially in a volatile market such as forex. On the other hand, a signal can easily become useless if a trader gets it too late. </p> <p dir="ltr">To make sure traders receive trading signals at the right time, providers send the signals through multiple communication channels like SMS, e-mail, push notifications. Another option is to <a href="/en/platformoverview">download platform add-ons</a> that allow traders to receive their signals directly on their trading platform. Some traders use social-trading communities to receive relevant forex signals.</p> <p dir="ltr">Simply put, f<strong>orex trading signals</strong> represent essential need-to-know info related to the market. In a lot of ways, a forex signal represents an immediate update that traders can incorporate into the trading decisions they execute. </p> <h2>Types of forex signals</h2> <p>Although a lot of signal services share some features, there is no universal signal service. In this article, we cover the four most common forex signal services.</p> <h3>Manual vs automated forex signals</h3> <p dir="ltr">This service is categorised based on the way the signals are generated. A manual Forex signal is created by an individual who’s usually an analyst or an experienced trader. This is because with <em>manual signal trading</em>, the trader has to make the final decision and the human intelligence factor plays a major role.</p> <p dir="ltr">In contrast, automated trading signals are created by a computer or software that monitors and analyses price action based upon coded algorithms. </p> <p dir="ltr">The main benefit that comes with the automatic signal trading route is that it excludes emotion and provides increased execution trading speed. However, it also has a disadvantage because you rely very much on a computer, system, or individual and it excludes the decision-making process.</p> <p> </p> <h3>Paid vs free forex signals</h3> <p>This category is based upon the price of a signal service operator. Just as their name states, free forex signal providers offer signals without requesting payment, while paid forex signal providers offer signals but require money for that service. The latter category usually requests one-time payments or monthly subscriptions.<br /> </p> <h3>Entry vs exit forex signals</h3> <p dir="ltr">This is a category based on the amount of detail of a trade suggestion. There are signal services that provide only entry signals, that tell a trader when to enter the market, and there are other providers that offer only exit signals that tell traders to close their open position. </p> <p><br /> Most of the time this concerns long-term forex trading signals on financial products that trend for extended periods of time. <strong>When it comes to short-term trading signals</strong>, a trade idea usually takes into account both entry and exit signals.</p> <h2>What is copy trading?</h2> <p dir="ltr">Copy trading is a type of trading that became incredibly popular over recent years because it lets new traders make a profit. As a matter of fact, there are more and more traders who develop the <strong>“people-based” </strong>portfolios where the idea is to invest in other investors who conduct the trades for you, instead of trading currencies yourself. </p> <p dir="ltr">There are a number of ways copy trading can be performed <a href="/en/platformoverview">based on the platform you select</a>. Whatever the platform, the main idea is the same - invest a part of your portfolio in a specific trader and copy all of their trades in a percentage-based way. </p> <p dir="ltr">Keep in mind that most platforms <strong>don’t allow investing over 20% of your portfolio</strong> in a single trader, in order to encourage portfolio diversification. This is actually an efficient policy as sometimes investors appear more skilful than they actually are or they go through a rough streak. That’s why it’s wise not to have too much of your portfolio invested in one trader. </p> <p dir="ltr">When it comes to monitoring graphs and statistics, copy trading is just like normal trading. However, the main difference is that in copy trading you’re monitoring actual people rather than market moves. That’s why it’s of utmost importance to check a trader’s portfolio before copying them. Learn about their strategy, track record as well as risk management strategies they use. </p> <p dir="ltr">One thing is for sure, copy trading is great for novice traders. It’s an easier way into the world of trading and it will let you make some money by generating trading opportunities from successful investors. Even if you start losing, you can’t lose everything thanks to the portfolio diversification policy. </p> <p dir="ltr">Remember that no type of trading guarantees success, but at least it’s a great way to gain trading experience. It’s a great way to learn about trading since you’re learning from more experienced and successful traders.</p> <h2><!--%3Cmeta%20charset%3D%22utf-8%22%20%2F%3E--><b id="docs-internal-guid-42451160-7fff-d07b-57ab-cb71aaea856b">Who provides forex signals?</b></h2> <p dir="ltr">As we’ve already mentioned, there are manual and automated signal providers. Manual providers are usually more experienced traders, market analysts and strategists. Manual providers provide trading opportunities that are derived from their trading experience, fundamental and technical analysis expertise as well as their trading strategies. </p> <p dir="ltr">On the other side, automated signal providers refer to computer software that is developed to create trading instructions when specific set parameters or conditions appear in the market.<strong> Expert Advisors (EA)</strong> is an example of automated signal providers as it utilises technical analysis techniques that are based on forecast indicators,<a href="/en/trading-academy/forex/sma-indicator"> </a><a href="/en/trading-academy/forex/sma-indicator">such as Moving Averages</a>, <a href="/en/trading-academy/forex/analysis-fibonacci-ratios">Fibonacci Levels</a><a href="/en/trading-academy/forex/analysis-fibonacci-ratios">,</a> and Stochastics. </p> <p dir="ltr">Alternatively, there are also other automated signal providers that use <a href="/en/trading-academy/forex/fundamental-analysis">fundamental analysis</a> methods, including monitoring economic news releases and market sentiment. You may prefer automated signal providers to manual signal providers, or the other way around, depending on what you are looking for. </p> <p><br /> You can also find platforms that collaborate with third-party signal providers for free on a daily and weekly basis through market review and analysis.</p> <p dir="ltr">One of the largest auto-trading communities in the world that’s worth mentioning is <strong>MQL5.</strong> Anyone can become a signal provider in this community, however, there are a number of conditions to fulfill to make sure you can subscribe to a signal provider that will suit your requirements. MQL5 assesses the confirmed trading results of all providers and rates them. </p> <p dir="ltr">Additionally, you are able to use different filtering options that will let you choose your preferred signal providers based on their percentage development, drawdown and manual or algorithmic trading. </p> <p dir="ltr">Also, this community will warn you about any provider that still hasn’t delivered enough forex signals or about new signal providers whose successful results could have happened by chance. Once you’re subscribed to an MQL5 signal provider, you will be able to copy trades of the trader you’ve selected.</p> <p> </p> <p> </p> <h2>How to use forex signals</h2> <p>First things first, make sure you choose a good broker. Reliable brokers use trustworthy platforms that are very important for providing signals in a reliable manner.</p> <p dir="ltr">Next, choose a proper provider. This is actually a more difficult task than it seems, even though there is a high number of choices for traders who want to use forex signal providers. This is one of the most important steps because executing trades based on unreliable signals can result in massive losses. You’re putting a lot of faith in the provider, so make sure you choose wisely. </p> <p dir="ltr">That’s why you should conduct a detailed research about available signal providers and choose a provider with a high reputation and reliability. </p> <p dir="ltr">Before you settle and choose a provider, learn about their trading performances and strategies. There are signal providers that offer a free trial period which you can subscribe to at a later stage in case you’re pleased with the results. </p> <p dir="ltr">When it comes to automated strategies, you can usually conduct backtesting to see how the computer would have done in various market circumstances. Also, testing signal providers <a href="https://portal.thinkmarkets.com/account/individual/demo" target="_blank">on a demo account</a> before risking real capital would be a wise thing to do. </p> <p dir="ltr">It’s also important to know that there are<a href="/en/platformoverview"> </a><a href="/en/platformoverview">trading platforms</a><a href="/en/platformoverview"> </a>that offer high customisation features which can really make the difference since not all signal providers will enrich your trading experience. A customisable platform will make sure you can adjust a reliable signal to your investment objectives and aspirations. </p> <p> </p> <p>Don’t forget trading with currency pairs can be short-term or long term. Short-term signals are used in day and intraday trading, while long-term signals are used for several days. Keep in mind that these signals are time-dependent so make sure you make use of a signal as soon as you get it. </p> <p> </p> <h2>Key takeaways</h2> <ul dir="ltr"> <li role="presentation">Trading signals are generated either by a human analyst or trader or an automated platform supplied to a subscriber of the forex signal service.</li> <li role="presentation">Forex signals offer advantages as they allow traders to make a profit while still gaining knowledge about the world of trading with currencies.</li> <li role="presentation">Copy trading allows for investing in other investors who conduct the trades for you, instead of trading currencies yourself. </li> <li role="presentation">There are signal providers that offer a free trial period which you can subscribe to later if you’re pleased with the results. </li> <li role="presentation">Always conduct backtesting to check how the computer would have done in various market circumstances.</li> </ul>