


Table of contents
- Trading signals generated by Ichimoku
- How to trade with Ichimoku Clouds
- Summary
The Ichimoku Cloud is a technical indicator primarily used by traders and analysts to define support and resistance levels.
Developed by Goichi Hosoda, a Japanese journalist who reportedly spent 30 years working on it, the Ichimoku Cloud is also used to identify trend direction, gauge momentum, and generate applicable trading signals.
Also known as the ‘Ichimoku Kinko Hyo’ indicator, which translates into a “one look equilibrium chart”, Ichimoku may look complicated, but is easy to use. Structure The Ichimoku Cloud’s four major elements are moving averages that show the high and low over a given period of time.
Here, we provide a brief breakdown of these four components:
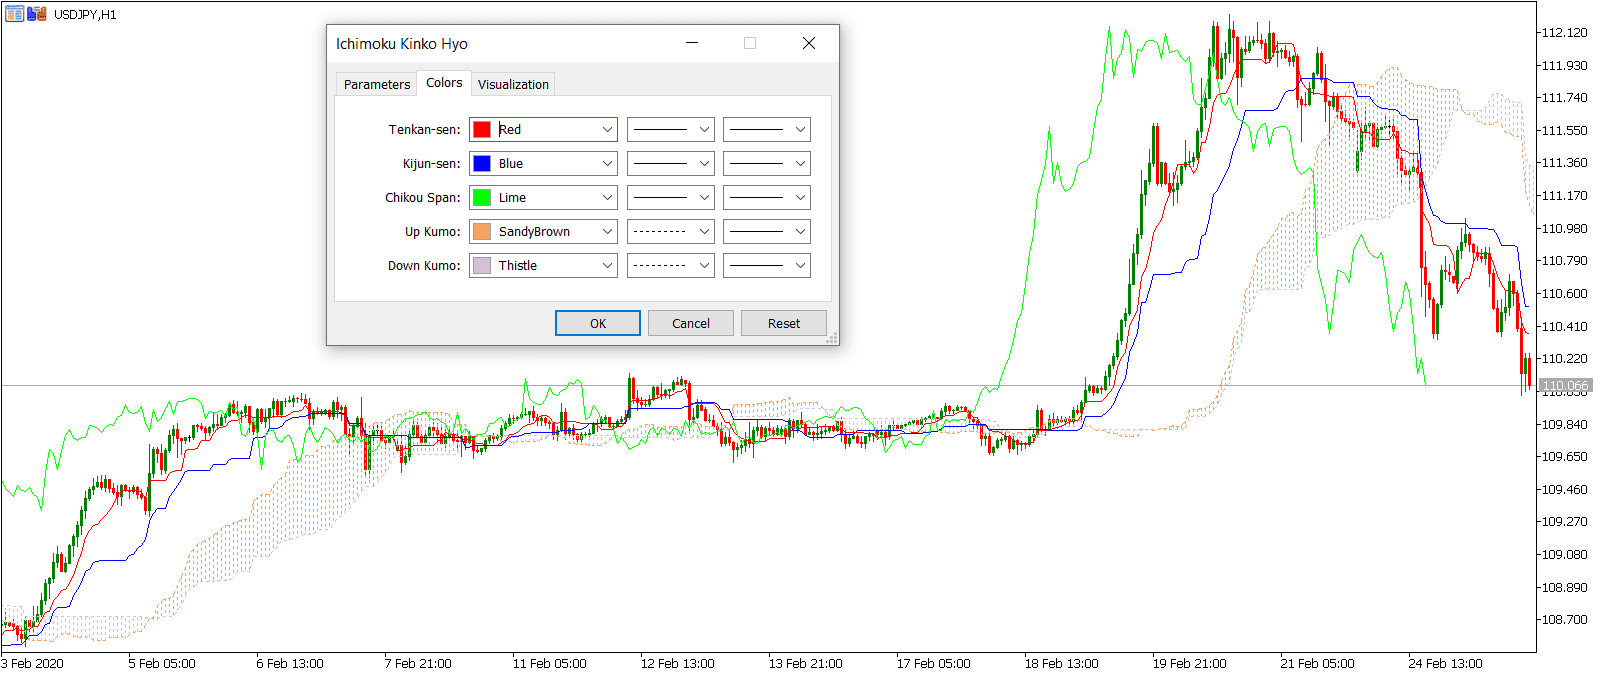
As you can see below, we applied the Ichimoku indicator on the USD/JPY hourly chart.
The MetaTrader 5 (MT5) platform offers a simple way of adding this indicator to your chart by selecting it from the drop-down menu.
As you can see, the Tenkan Sen is the fastest of all elements and the most sensitive moving average, given that it is designed based on nine periods only.
As a result, this element follows the price action very closely and has the quickest reaction of all to any sharp movement in the price action.
In this segment we will explain how to use the Ichimoku Cloud. Generally speaking, the indicator is better fit for longer time frames.
Kumo is arguably the most important element of the Ichimoku Cloud. It is designed in such a way that if the asset’s price trades below the Cloud, the indicators signal that we are trading in a downtrend and vice versa. A break in the Cloud is seen as a signal to enter a trade, since this is a confirmation that the market trades in an uptrend/downtrend.
The most important functions of the Ichimoku indicator is to identify trend direction and generate trading signals.
As you will see, Kumo also changes colours based on the trend direction. Whenever the Senkou Span A rises above the Senkou Span B, the idea that the market trades in an uptrend is further strengthened.
The default MT5 setting paints the cloud in “SandyBrown” colour when the Kumo trades upwards. On the other hand, when a Span A falls below Span B, the downtrend is bolstered. In this case, MT5 default setting paints the cloud in “Thistle” colour.
Besides Kumo, the second situation that traders monitor is the relationship between Tenkan and Kijun. Here, the former is seen as a short-term moving average, while the Kijun acts as the baseline.
In this regard, any situation where Tenkan moves below Kijun signals a downtrend in the price action, and vice versa. In order to further validate the trade signal, you may want to consult Kumo and see whether it is generating the same signal.
Finally, the third situation involves the position of Chikou Span on a chart. If Chikou trades above the price action, it would confirm bullish sentiment; if below, vice versa. A clean trading signal is generated once all three situations point towards the same trend - bullish or bearish.
As seen below, there are two situations we want to explain here. In the first situation, Tenkan drops below Kijun and provides us with a trading signal that the price action may change its course and form the uptrend shift to a downtrend.
However, at this point both the cloud and Chikou Span are trading below the price action, meaning that the trading signal generated by the relationship between Tenkan and Kijun is not confirmed.
The situation marked by number #2 is different. For some time now, the price action has been moving lower. At one point, USD/JPY breaks under the cloud as the red line still trades below the blue line.
Finally, Chikou is trading below the market’s price, which means that finally all three elements are providing the same bearish signal.
Of course, for the bullish signal you should just apply the reverse logic. You want to enter a long trade if the blue line trades above red, the price action is above the cloud and above Chikou Span.
You are now in a trade and there are two more decisions to be made. One, the stop-loss should be placed above the high of the candle within the cloud formation. Ideally, you should also consult other support and resistance levels before deciding on a stop-loss.
The same applies for a take profit order, which should be set based on the money management principles and risk tolerance. Again, always consult other indicators and technical levels of support and resistance.
Developed by Goichi Hosoda, a Japanese journalist who reportedly spent 30 years working on it, the Ichimoku Cloud is also used to identify trend direction, gauge momentum, and generate applicable trading signals.
Also known as the ‘Ichimoku Kinko Hyo’ indicator, which translates into a “one look equilibrium chart”, Ichimoku may look complicated, but is easy to use. Structure The Ichimoku Cloud’s four major elements are moving averages that show the high and low over a given period of time.
Here, we provide a brief breakdown of these four components:
- The Tenkan Sen (conversion line) is calculated by the sum of the highest high and the lowest low divided by two. The default setting is 9 periods.
- The Kijun Sen (standard or base line) is based on the same formula as the Tenkan Sen, but the default here is 26 periods.
- The Chikou Span (lagging span) represents the current closing price time shifted backwards 26 periods
- The Kumo (cloud) consists of two lines - the Senkou spans A and B. The former one is calculated by the adding Tenkan Sen and Kijun Sen and then divided by two, shifted forwards 26 periods. The latter represents the highest high + lowest low)/2 for the last 52 periods, also shifted 26 periods in the future.
As you can see below, we applied the Ichimoku indicator on the USD/JPY hourly chart.
The MetaTrader 5 (MT5) platform offers a simple way of adding this indicator to your chart by selecting it from the drop-down menu.
As you can see, the Tenkan Sen is the fastest of all elements and the most sensitive moving average, given that it is designed based on nine periods only.
As a result, this element follows the price action very closely and has the quickest reaction of all to any sharp movement in the price action.
Trading signals generated by Ichimoku
In this segment we will explain how to use the Ichimoku Cloud. Generally speaking, the indicator is better fit for longer time frames.
Kumo is arguably the most important element of the Ichimoku Cloud. It is designed in such a way that if the asset’s price trades below the Cloud, the indicators signal that we are trading in a downtrend and vice versa. A break in the Cloud is seen as a signal to enter a trade, since this is a confirmation that the market trades in an uptrend/downtrend.
The most important functions of the Ichimoku indicator is to identify trend direction and generate trading signals.
As you will see, Kumo also changes colours based on the trend direction. Whenever the Senkou Span A rises above the Senkou Span B, the idea that the market trades in an uptrend is further strengthened.
The default MT5 setting paints the cloud in “SandyBrown” colour when the Kumo trades upwards. On the other hand, when a Span A falls below Span B, the downtrend is bolstered. In this case, MT5 default setting paints the cloud in “Thistle” colour.
Besides Kumo, the second situation that traders monitor is the relationship between Tenkan and Kijun. Here, the former is seen as a short-term moving average, while the Kijun acts as the baseline.
In this regard, any situation where Tenkan moves below Kijun signals a downtrend in the price action, and vice versa. In order to further validate the trade signal, you may want to consult Kumo and see whether it is generating the same signal.
Finally, the third situation involves the position of Chikou Span on a chart. If Chikou trades above the price action, it would confirm bullish sentiment; if below, vice versa. A clean trading signal is generated once all three situations point towards the same trend - bullish or bearish.
How to trade with Ichimoku Clouds
Let's break down the trading with the Ichimoku indicator in simple steps. For this, we'll look at the USD/JPY hourly chart.As seen below, there are two situations we want to explain here. In the first situation, Tenkan drops below Kijun and provides us with a trading signal that the price action may change its course and form the uptrend shift to a downtrend.
However, at this point both the cloud and Chikou Span are trading below the price action, meaning that the trading signal generated by the relationship between Tenkan and Kijun is not confirmed.
The situation marked by number #2 is different. For some time now, the price action has been moving lower. At one point, USD/JPY breaks under the cloud as the red line still trades below the blue line.
Finally, Chikou is trading below the market’s price, which means that finally all three elements are providing the same bearish signal.
Of course, for the bullish signal you should just apply the reverse logic. You want to enter a long trade if the blue line trades above red, the price action is above the cloud and above Chikou Span.
You are now in a trade and there are two more decisions to be made. One, the stop-loss should be placed above the high of the candle within the cloud formation. Ideally, you should also consult other support and resistance levels before deciding on a stop-loss.
The same applies for a take profit order, which should be set based on the money management principles and risk tolerance. Again, always consult other indicators and technical levels of support and resistance.
Summary
- The Ichimoku Cloud is primarily used to identify trend direction, gauge momentum and come up with applicable trading signals.
- It consists of four key elements: the Tenkan Sen, the Kijun Sen, Chikou Span, and Kumo (the cloud)
- Traders primarily monitor three situations: the crossover between Tenkan and Kijun, the point where the cloud breaks of the cloud in one of two directions, and the location of Chikou on the chart.
FAQs
Can you trade forex on weekends?
Forex trading is available 24 hours a day, every weekday – Monday to Friday. However, it is closed during the weekends.
Can I teach myself how to trade forex?
Yes, you can learn how to trade forex by yourself. The best way to go around it is to start with the basics and expand your knowledge gradually, practising everything you learn on a demo account.
What are leverage and margin in forex trading?
Leverage in forex means using borrowed funds from a broker to open trades larger than your capital. Margin defines the amount you need to deposit to open a trade.
What is the swap rate in forex?
A swap rate in forex is a small fee for keeping a CFD position open overnight.


