

 AE
AE


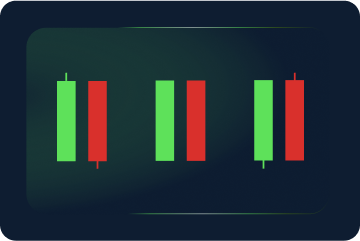
Table of contents
- Marubozu candlestick structure
- How does a Marubozu pattern work?
- How to trade with a Marubozu candlestick pattern
- How to trade with a bullish Marubozu
- How to trade with a bearish Marubozu
Marubozu candlestick structure
A Marubozu candle is very easy to spot because of its prominent structure. A candle consists of a long body created by a big gap between the opening and closing price and a very short wick on either side or no wicks at all.Depending on the presence and location of a wick, analysts define three types of Marubozu candles:
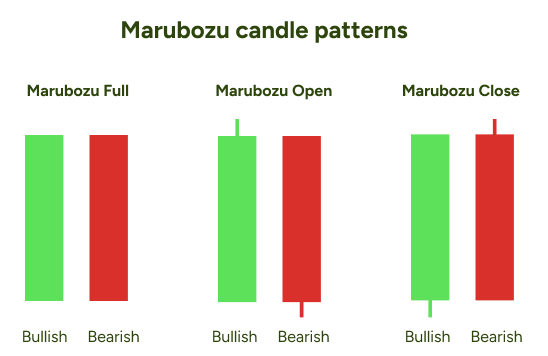
In all three cases, this candle has bullish and bearish versions.
In general, for a pattern to be classified as a Marubozu candlestick formation, at least one of its wicks has to be missing. In the bullish Marubozu Full, for example, the opening price is the lowest level, and the closing price is the highest price of the candle. This means that the instrument’s price opens the session, starts rallying in a certain direction and closes at the exact end. Thus, open and close are at the same price as the high and low.
As for the bullish Marubozu Open, the opening price is also the session low, indicating that buyers took control from the very start of the trading session. However, the closing price on the other side of the body can slightly differ from the high/low, leaving some room for a short wick.
The Marubozu Close candle is the opposite version of the Marubozu Open.
How does a Marubozu pattern work?
Marubozu candle patterns send a powerful message – the market is moving in one direction. This applies to Marubozu Open and Close candles, too, despite their small wicks, as buying or selling pressure was so strong that it overwhelmed the other side of the market.In general, bearish Marubozu candles signal that the sellers are in full control as they dominated the session in the desired direction, and vice versa for the bullish Marubozu candles.
How to trade with a Marubozu candlestick pattern
The rule of thumb with Marubozu candles is to trade in the direction of a candle. It is generally considered a continuation pattern, but due to the length of its body, continuation implies following the direction of the candle itself, not necessarily the trend's direction.How to trade with a bullish Marubozu
For example, in the price chart below, you can see a bullish Marubozu Open candlestick in action.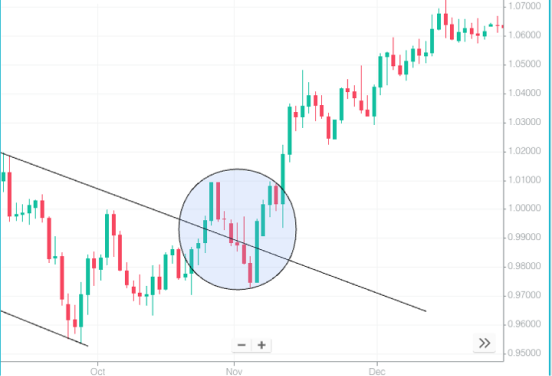
After a downtrend, the price movements consolidated into trading sideways with short-term highs and lows. At one point, bulls took charge by pushing the price higher, creating a Marubozu Open candle.
This means that bulls controlled the market from the candle’s opening price to the closing. Following such a strong bullish signal, the trend continued moving upward.
How to trade with a bearish Marubozu
On the second image, you can see the opposite scenario. A long bearish Marubozu candle was formed in an uptrend, leading to its reversal. The candle indicated that bears gained control, and the market started forming new lows and lower highs.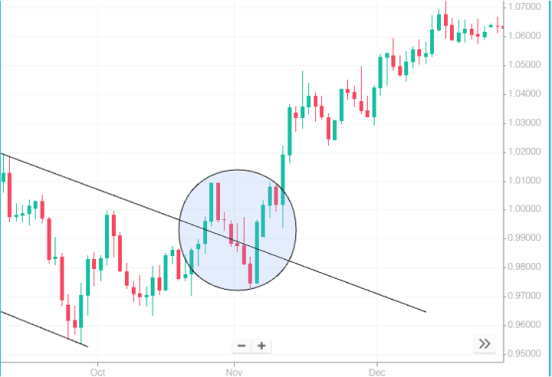
However, in both trading charts, you can see other Marubozu candles and where the market didn’t follow their directions. It happens because this pattern is not as precise as some other Japanese candlestick patterns. Moreover, it only confirms the fact that there is never a guaranteed outcome in the financial markets and all technical analysis tools provide only a suggestion. That’s why professional traders use several tools to combine their findings and make informed decisions.
For example, support and resistance levels can be very helpful when you trade with a Marubozu candle. If a candle closes right before one of those levels, the price will likely bounce off and move in the opposite direction – away from the level.
In some cases, a Marubozu candle opens at a support/resistance level, crosses it and closes on the other side. This means that bears/bulls were strong enough to break through an earlier established barrier and may indicate a stronger suggestion to trade in the direction of the candle.
It is also very important to place a stop loss according to your risk appetite. Many traders have their stop loss at the candle’s opening or closing price depending on if trading the bullish or bearish pattern. Create a free demo account today and try finding Marubozu candles on the charts. Learn how you can use technical analysis and risk management tools in a risk-free trading environment with ThinkMarkets. To learn more about candlestick patterns, check out our next article, where we explain how Tweezer candles work.
FAQs
What is a perfect Marubozu candlestick?
Some traders call a Marubozu Full candle a ‘perfect’ Marubozu due to its shape with no wicks, unlike most other candlestick patterns.
Does the colour of a Marubozu pattern matter?
The colour of a Marubozu candle indicates the direction of a price movement. Thus, when the green (bullish) Marubozu appears, it suggests an upward movement, while the red (bearish) indicates a downward movement.
Is a Marubozu candle bearish or bullish?
The candle itself can be both bullish and bearish. However, as a candlestick pattern, it is not considered either. Most traders use Marubozu candlestick patterns as a continuation signal.
What is a Marubozu candle strategy?
As a Marubozu candle indicates that the price is moving strongly in one direction, most traders enter the market in the same direction as this candle suggests. However, a Marubozu candle on its own is not considered a strong trading signal, and it is important to use additional technical analysis to confirm the findings.


